

Enterprise Real Estate Strategy Creator
Company: CBRE — Advisory & Transactions Services | Duration: 7 months
My Role: Principal UX Designer — User research when required, end-to-end user experience, user testing, concept validation, and managing additional UX resources.
Team: 1 Designer, 1 Business Lead, 2 Product Managers, 6 Engineers, 2 Data Scientists, 2 Part-Time Designers
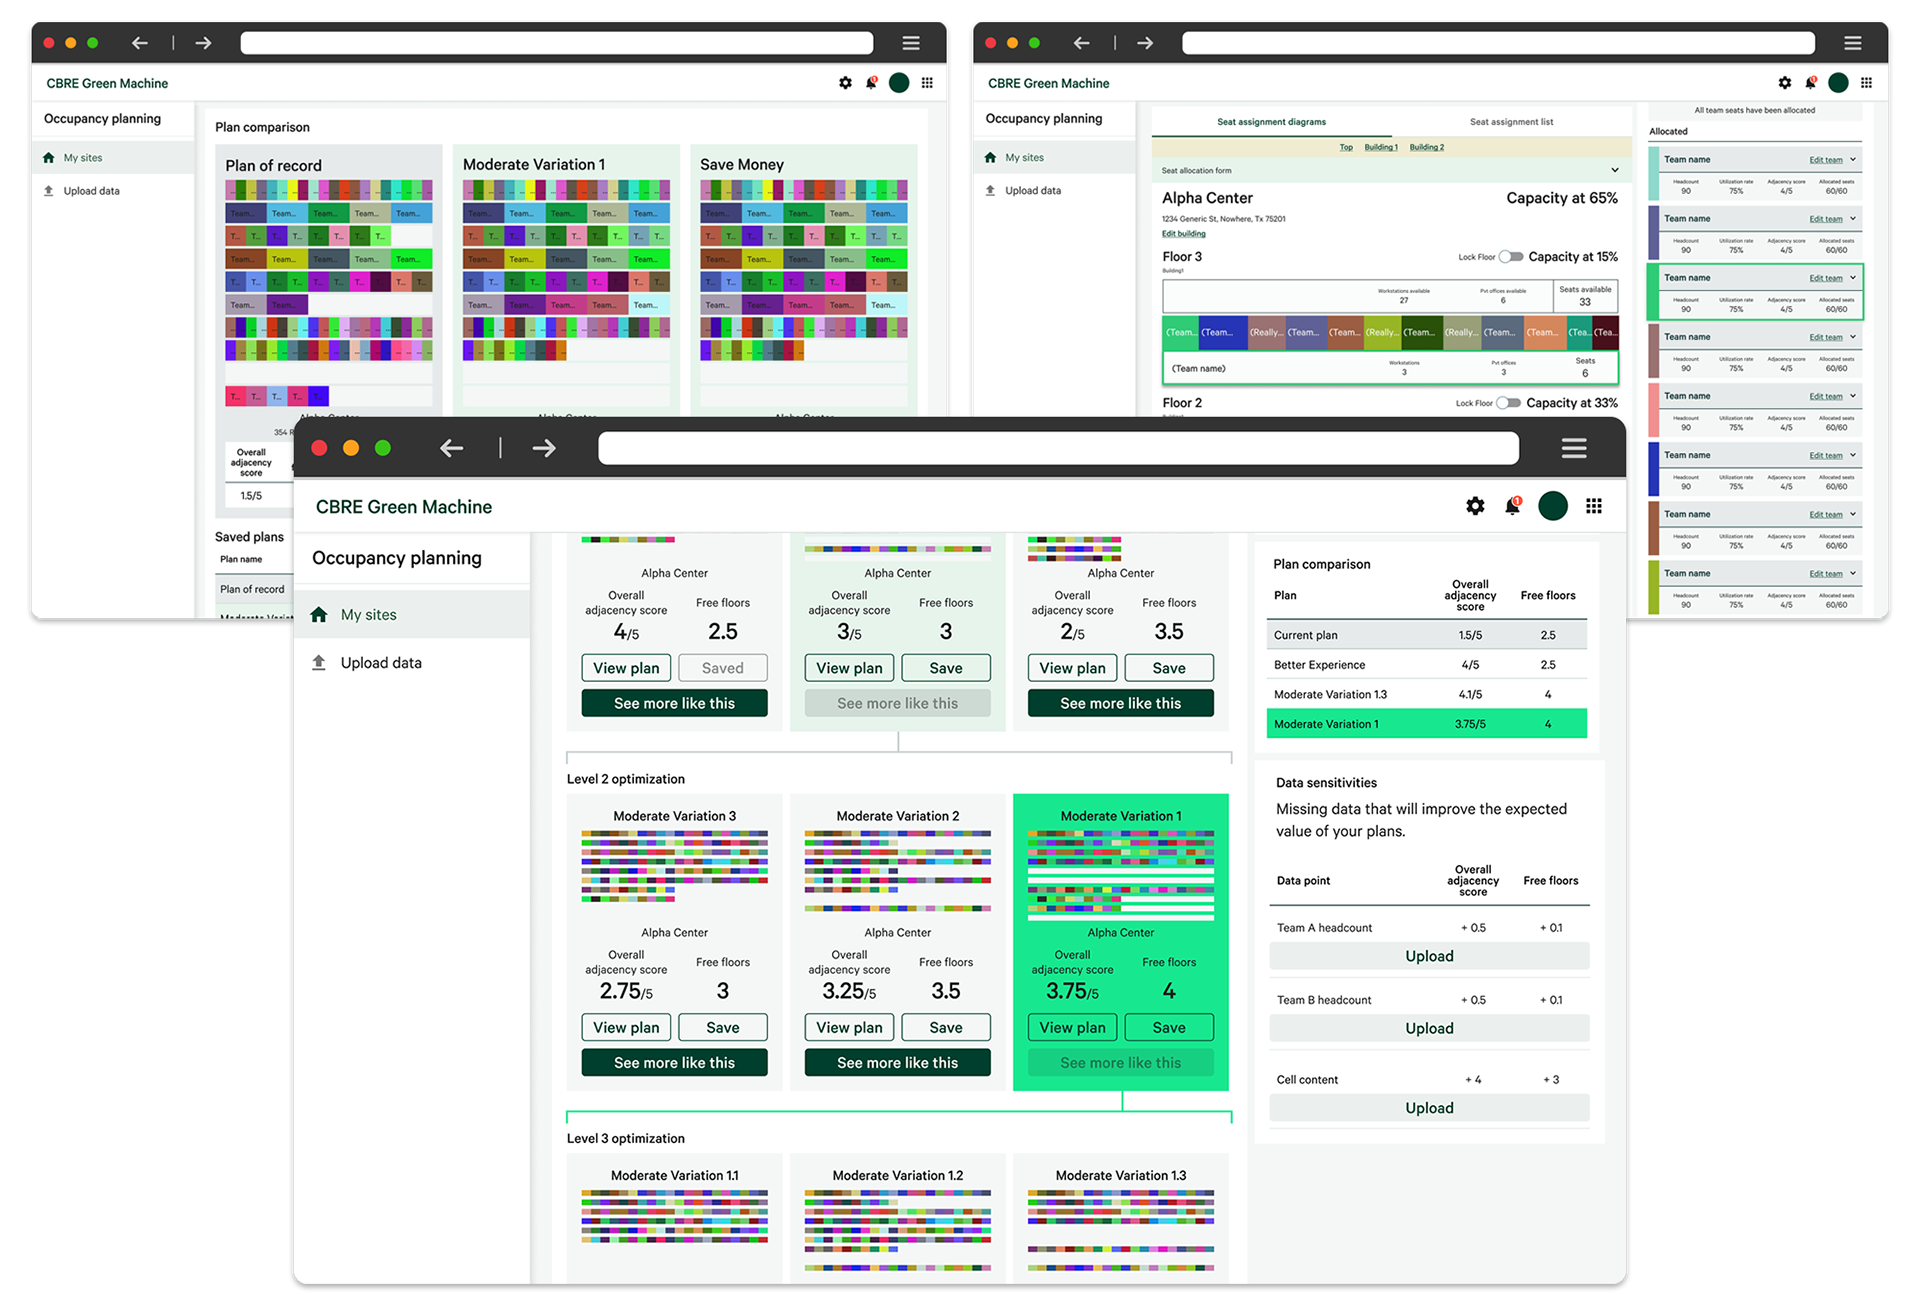
Table of Contents
1. Overview
2. Understanding Users
3. Gathering Requirements with Story Maps
4. Validating Concepts
5. Creating a Structured Backlog
6. Improving the Process
7. Experience Spotlight (wireframes)
8. Post Project Assessment
2. Understanding Users
3. Gathering Requirements with Story Maps
4. Validating Concepts
5. Creating a Structured Backlog
6. Improving the Process
7. Experience Spotlight (wireframes)
8. Post Project Assessment
1. Overview

I designed strategy planning experiences for 3 user types, replacing a tedious and time-consuming manual process.
The Enterprise Real Estate Strategy Creator is a proof of concept that shows the value of a comprehensive strategy tool that can service the needs of the different user types in one system by:
• Being a singular resource for data
• Driving consistency across workstreams
• Automatically communicating conflicts to relevant users
• Making it easier to show all the options that inform strategic decision
Audience and Users
Large companies seeking consultation when creating enterprise real estate strategies are the primary audience. The primary users are:
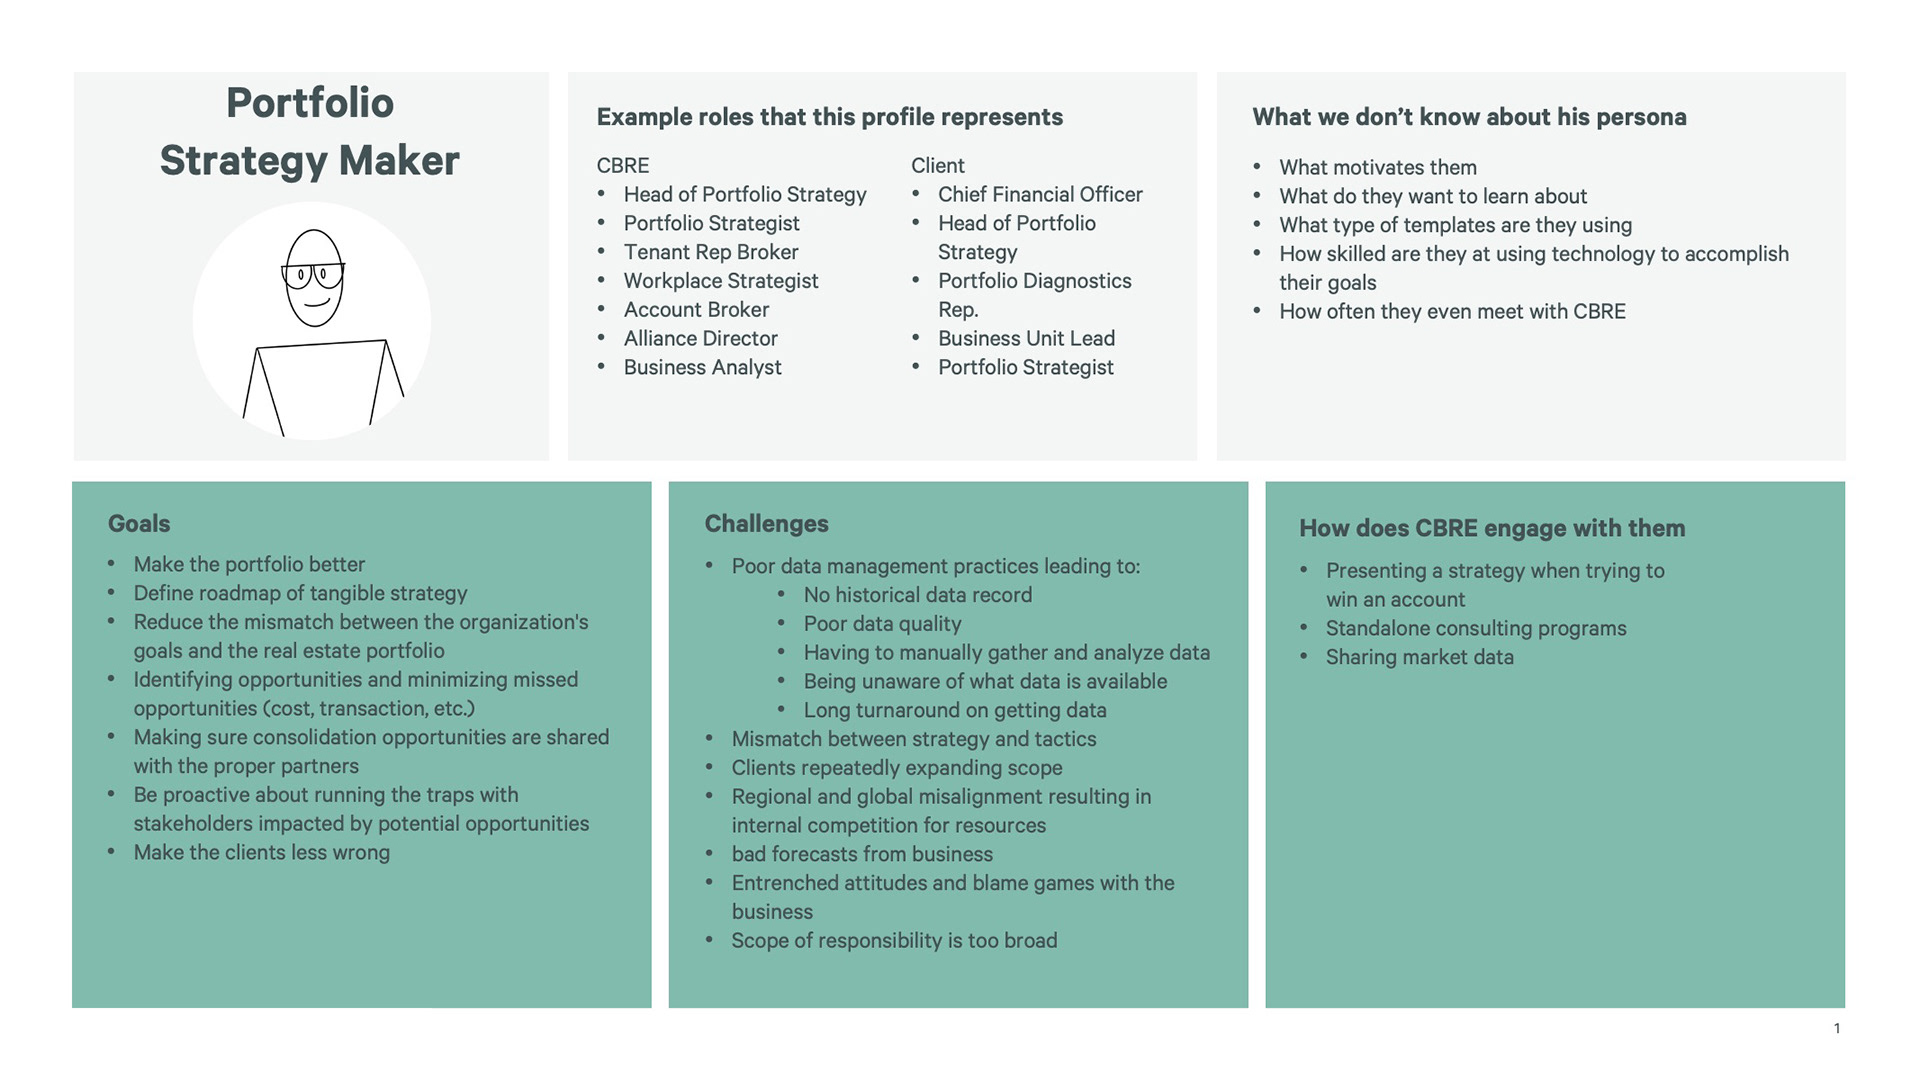
• The Portfolio Strategy Makers set the overall strategic direction.
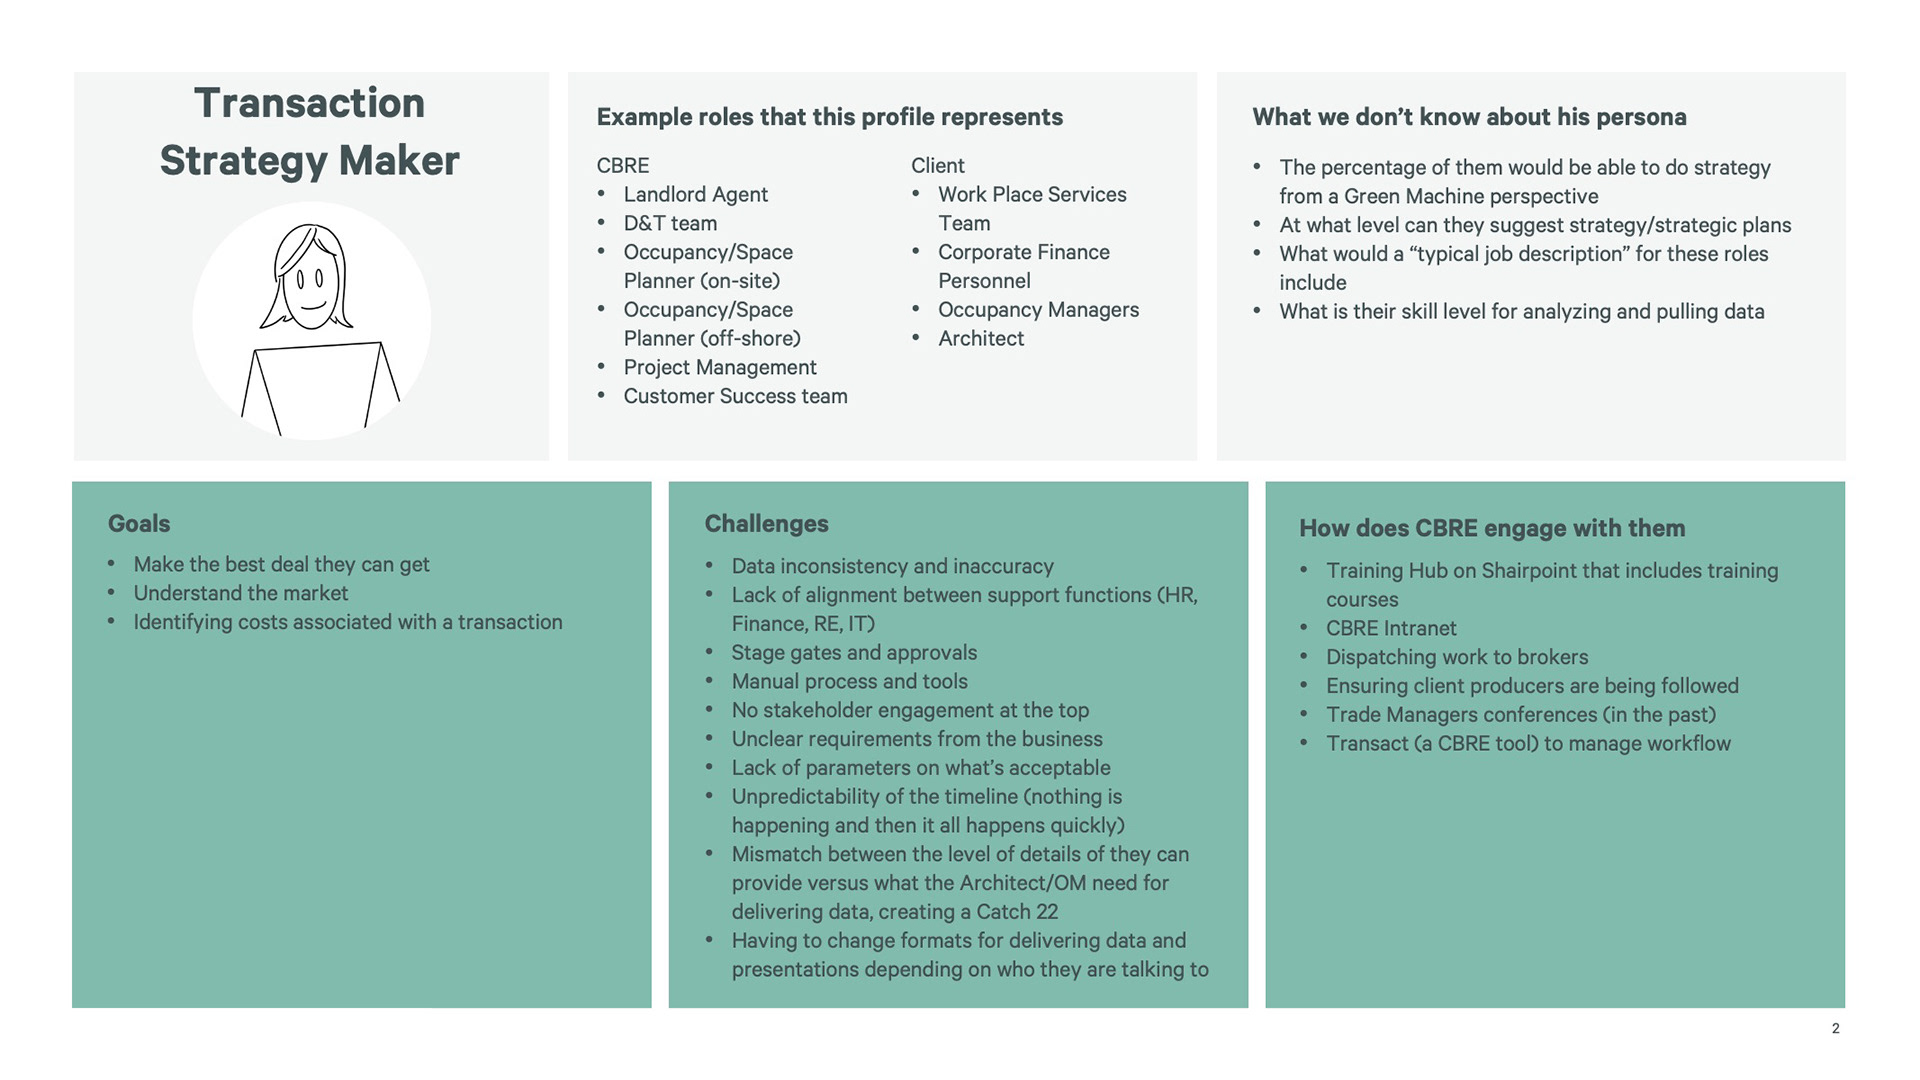
• Transaction Strategy Makers identify and plan for all the real estate transactions required.
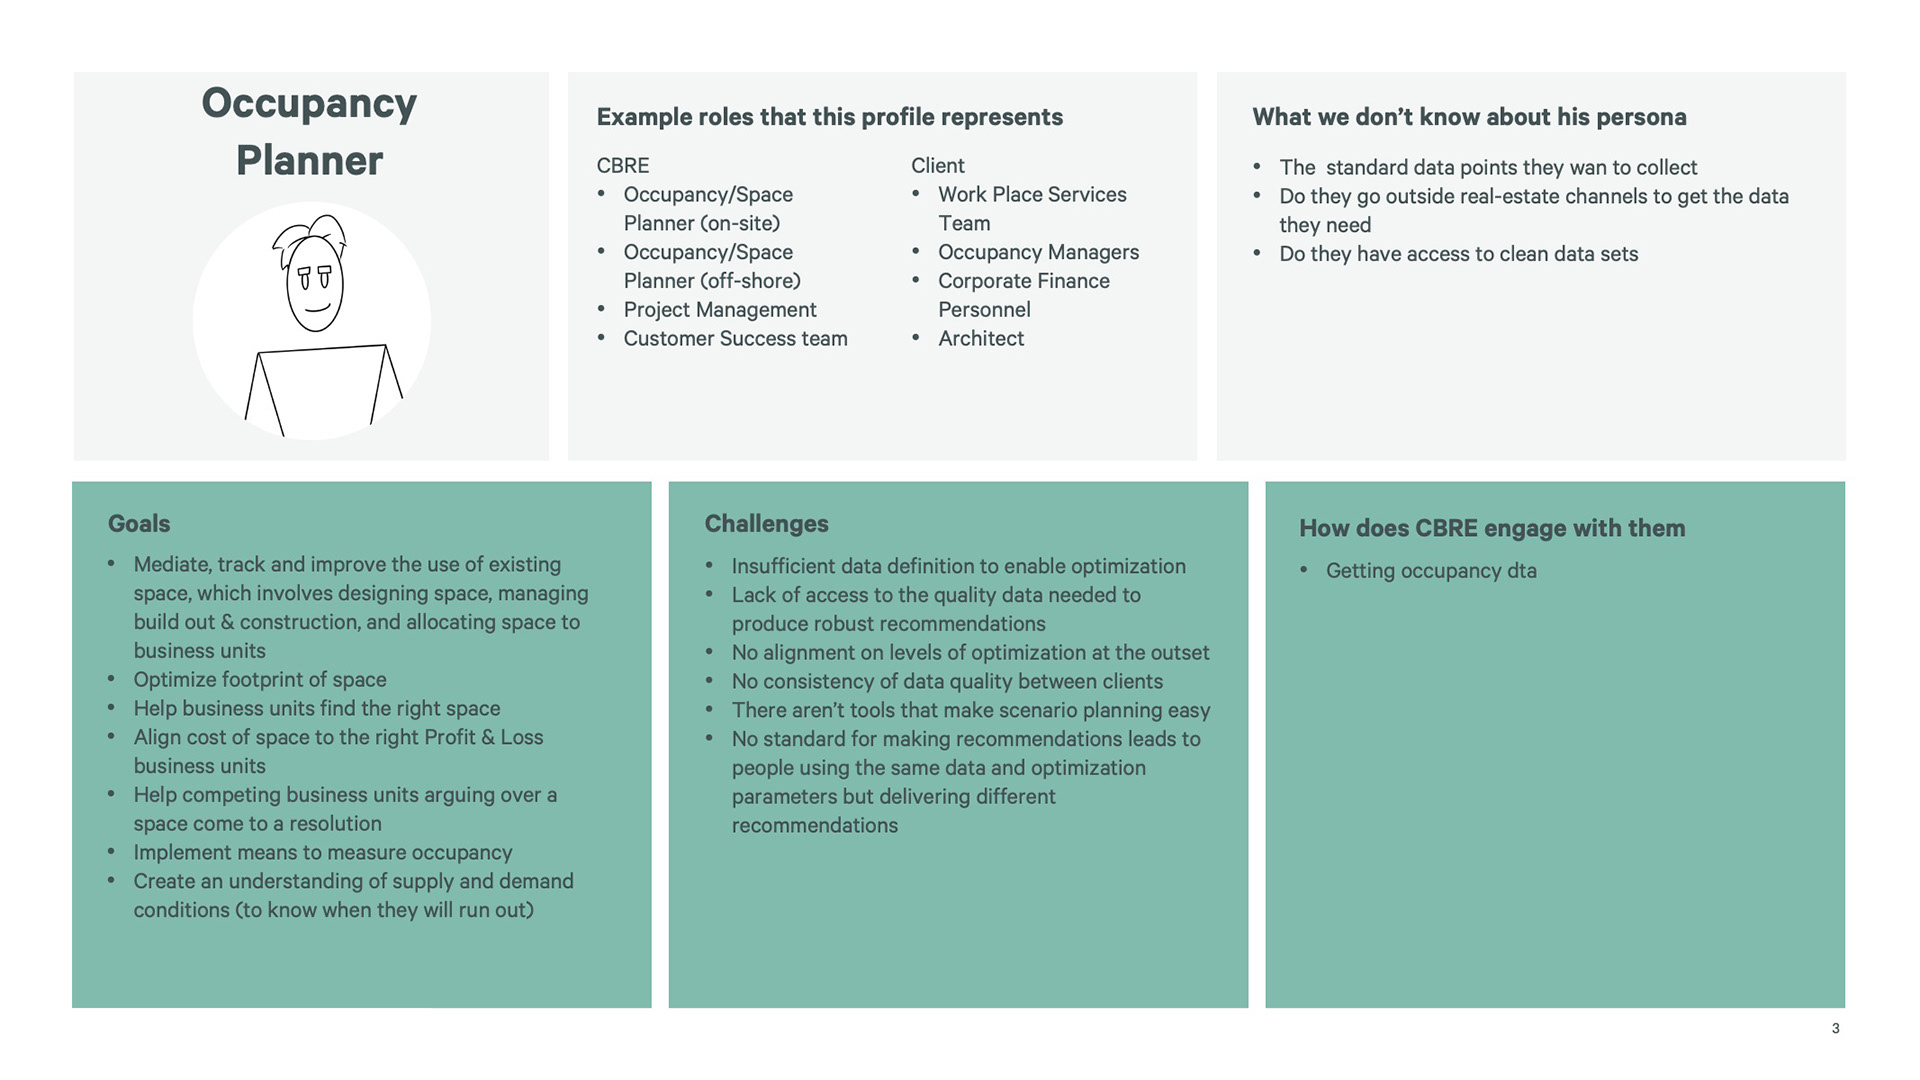
• Occupancy Planners ensure enough physical workspaces for the employees across different real estate properties.
Scope and Constraints
• Full end-to-end pilot experiences for 3 primary users
• A pitch presentation and high-level lo-fi wireframes were the only business requirement documentation available to start.
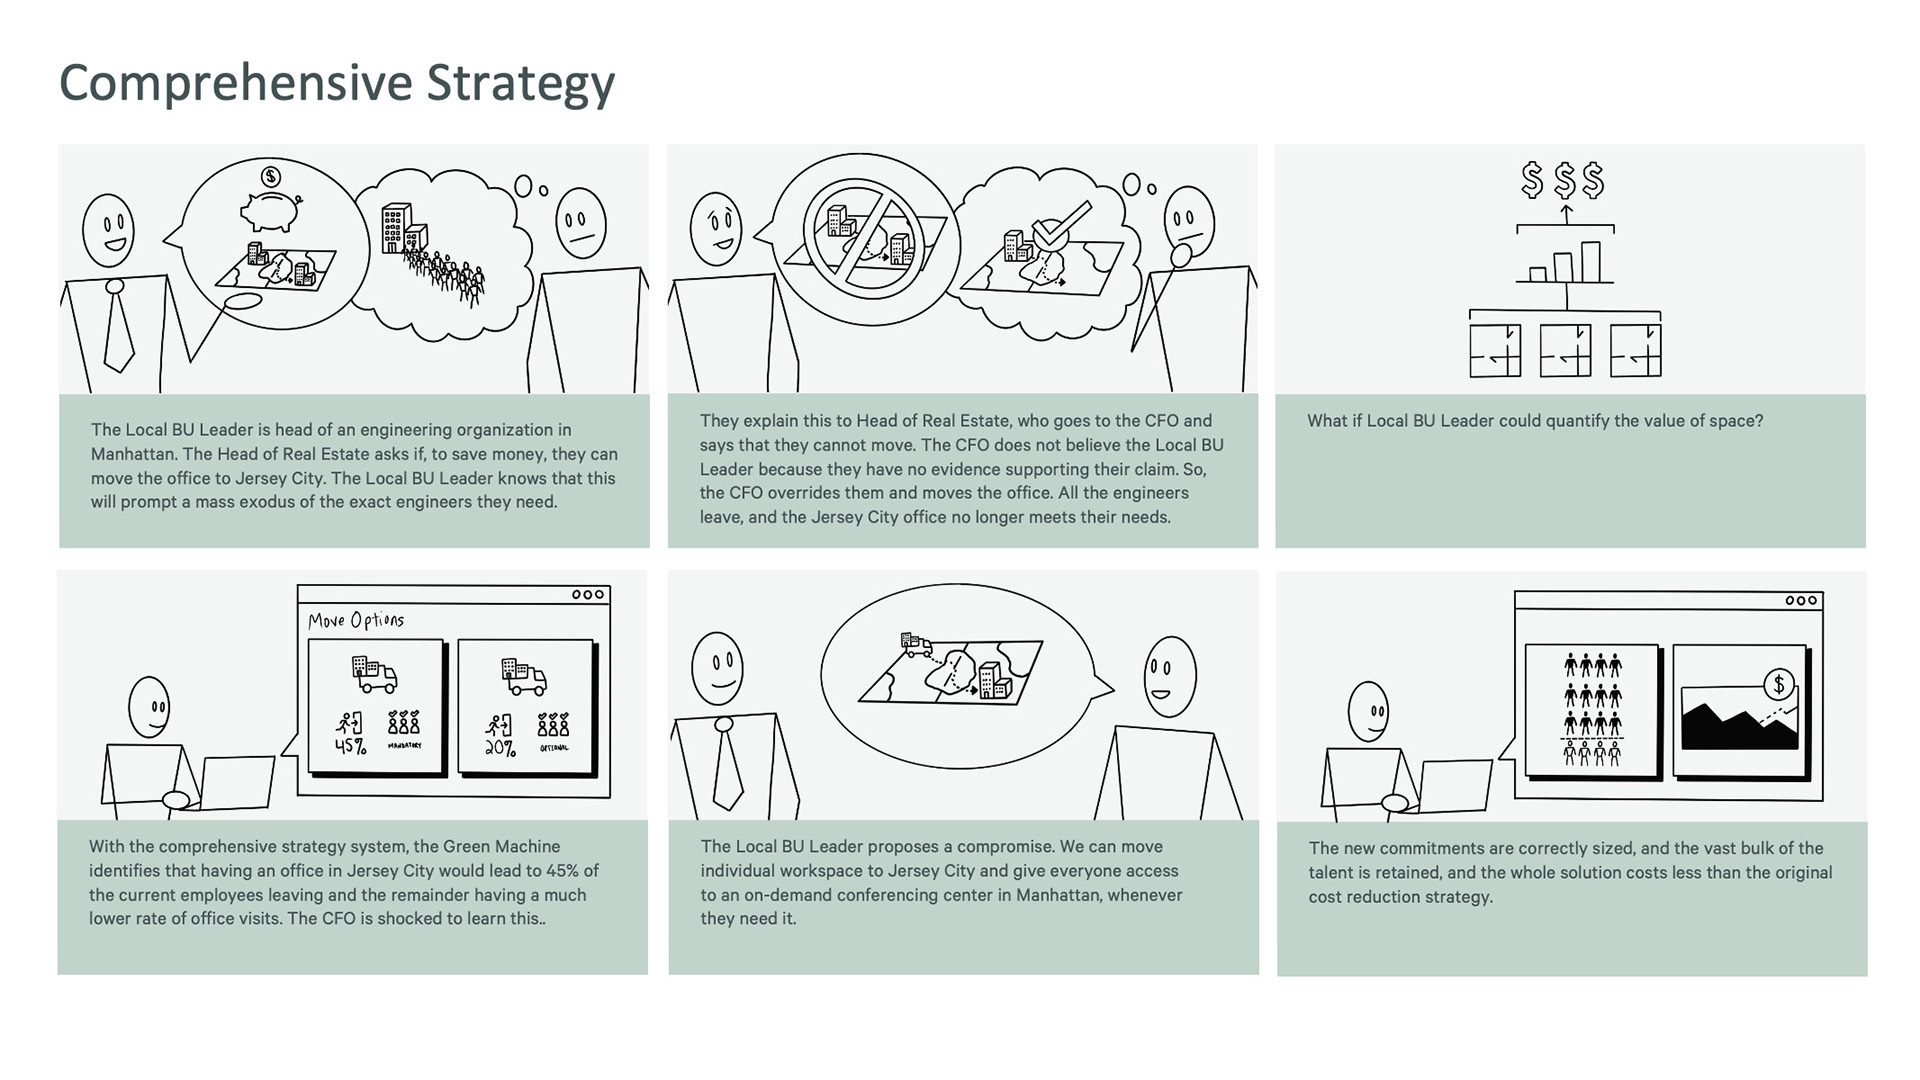
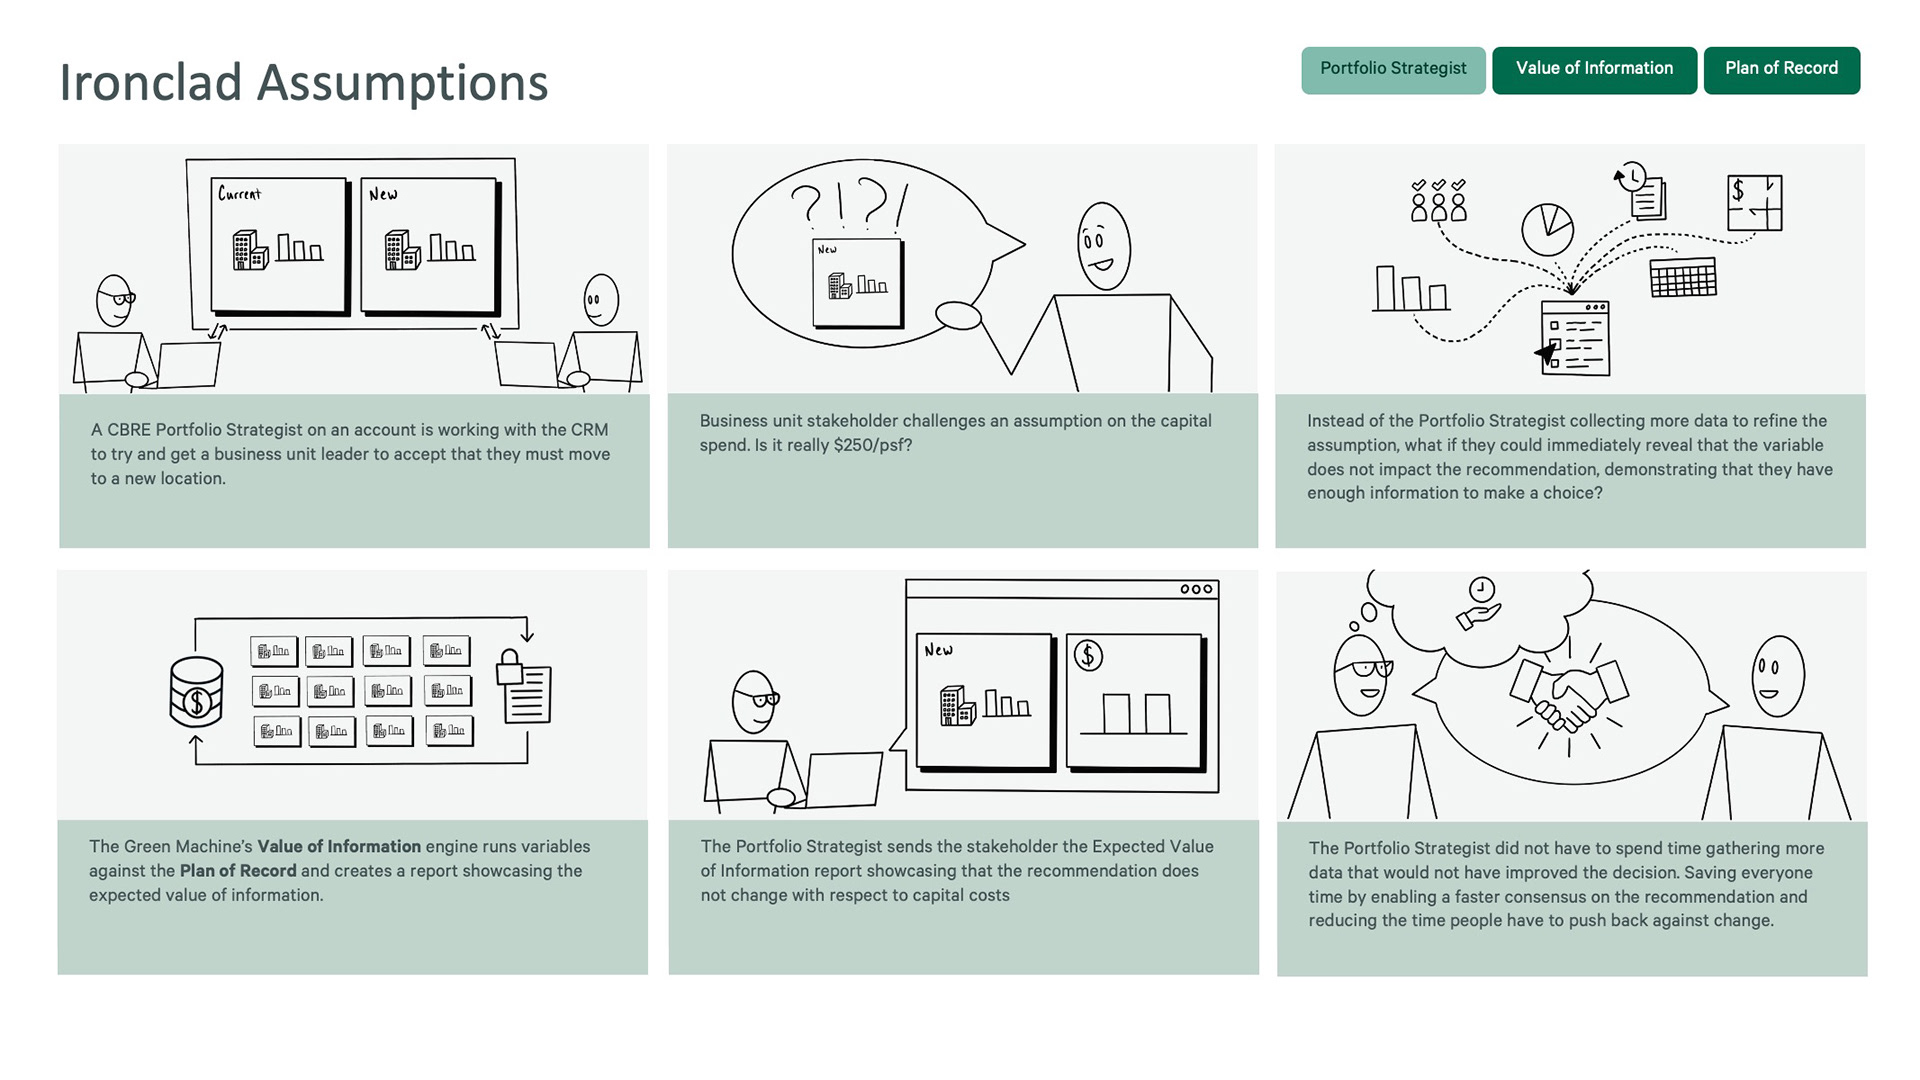
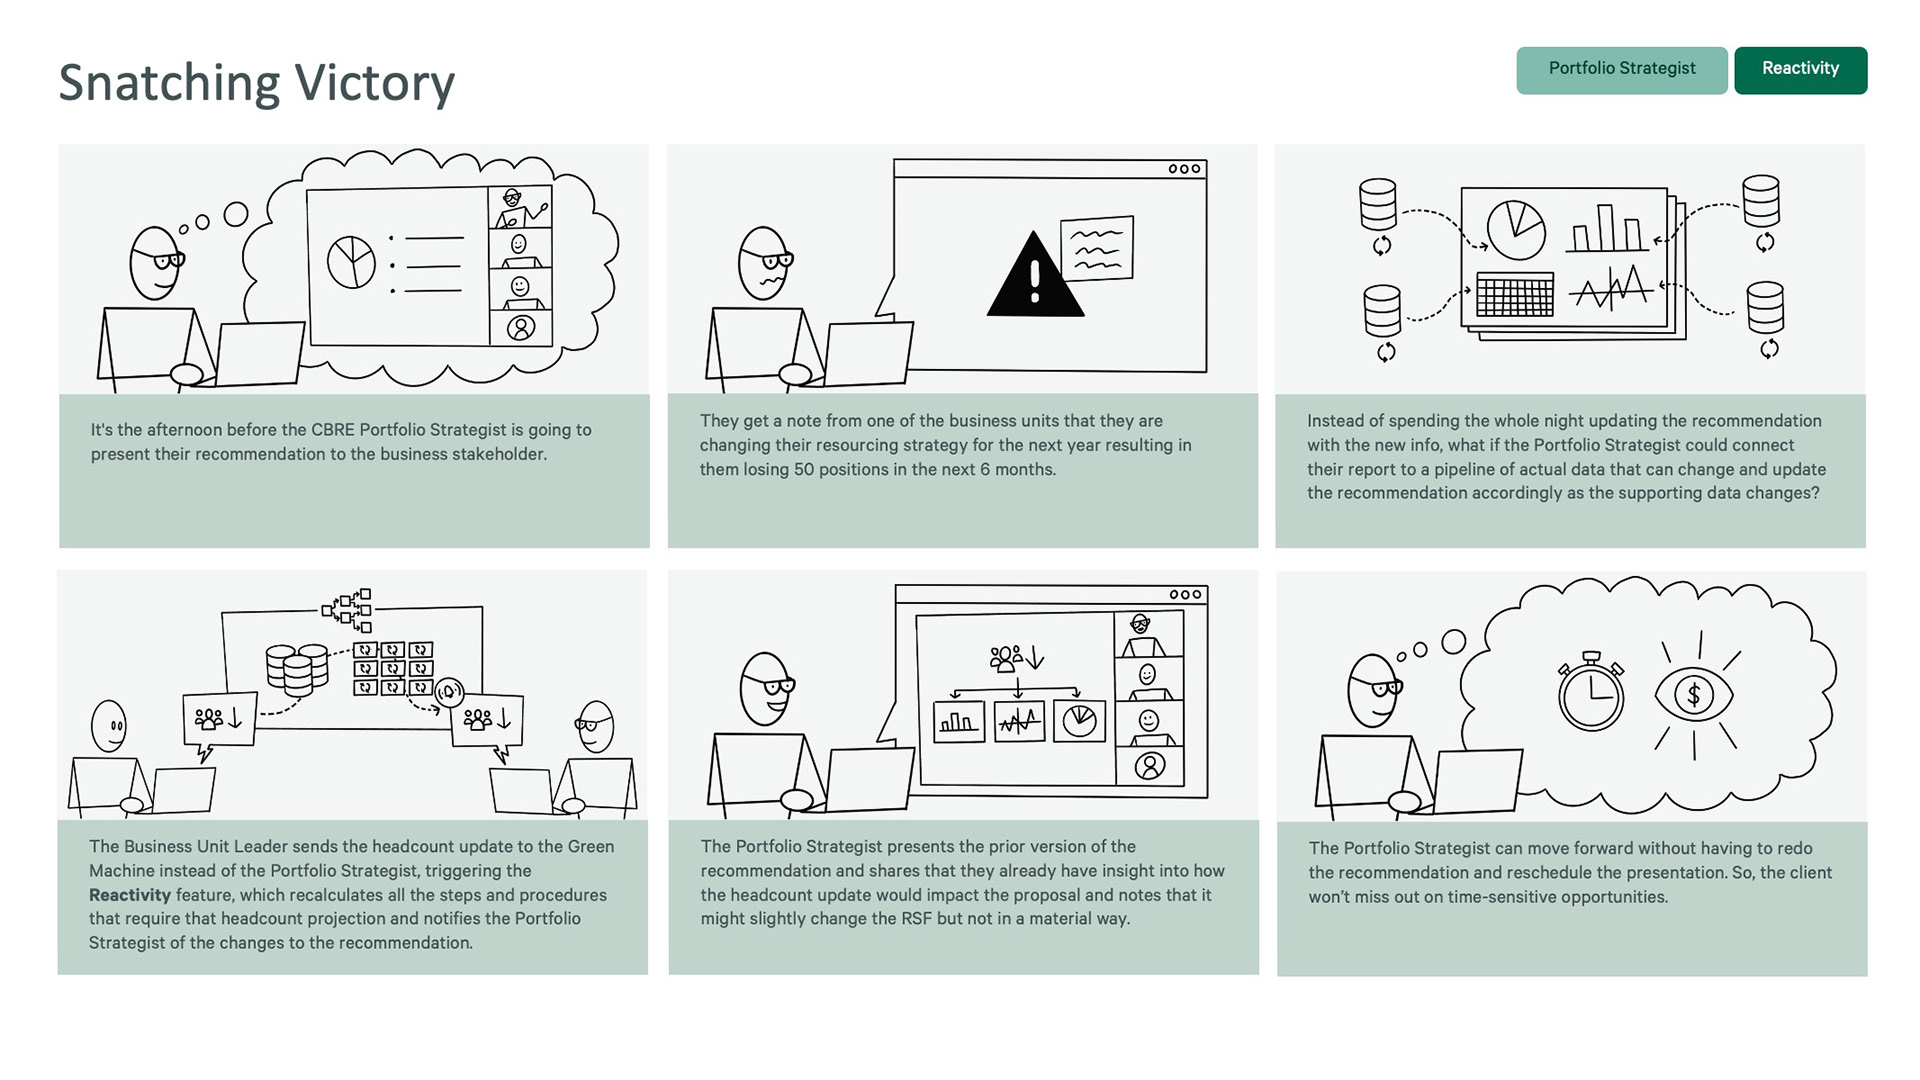
Portfolio Strategy Advisory teams contend with major 3 problems when creating strategies: data inconsistency, strategy misalignment, and decision-making transparency.
• Team members must build their strategies using low-quality data.
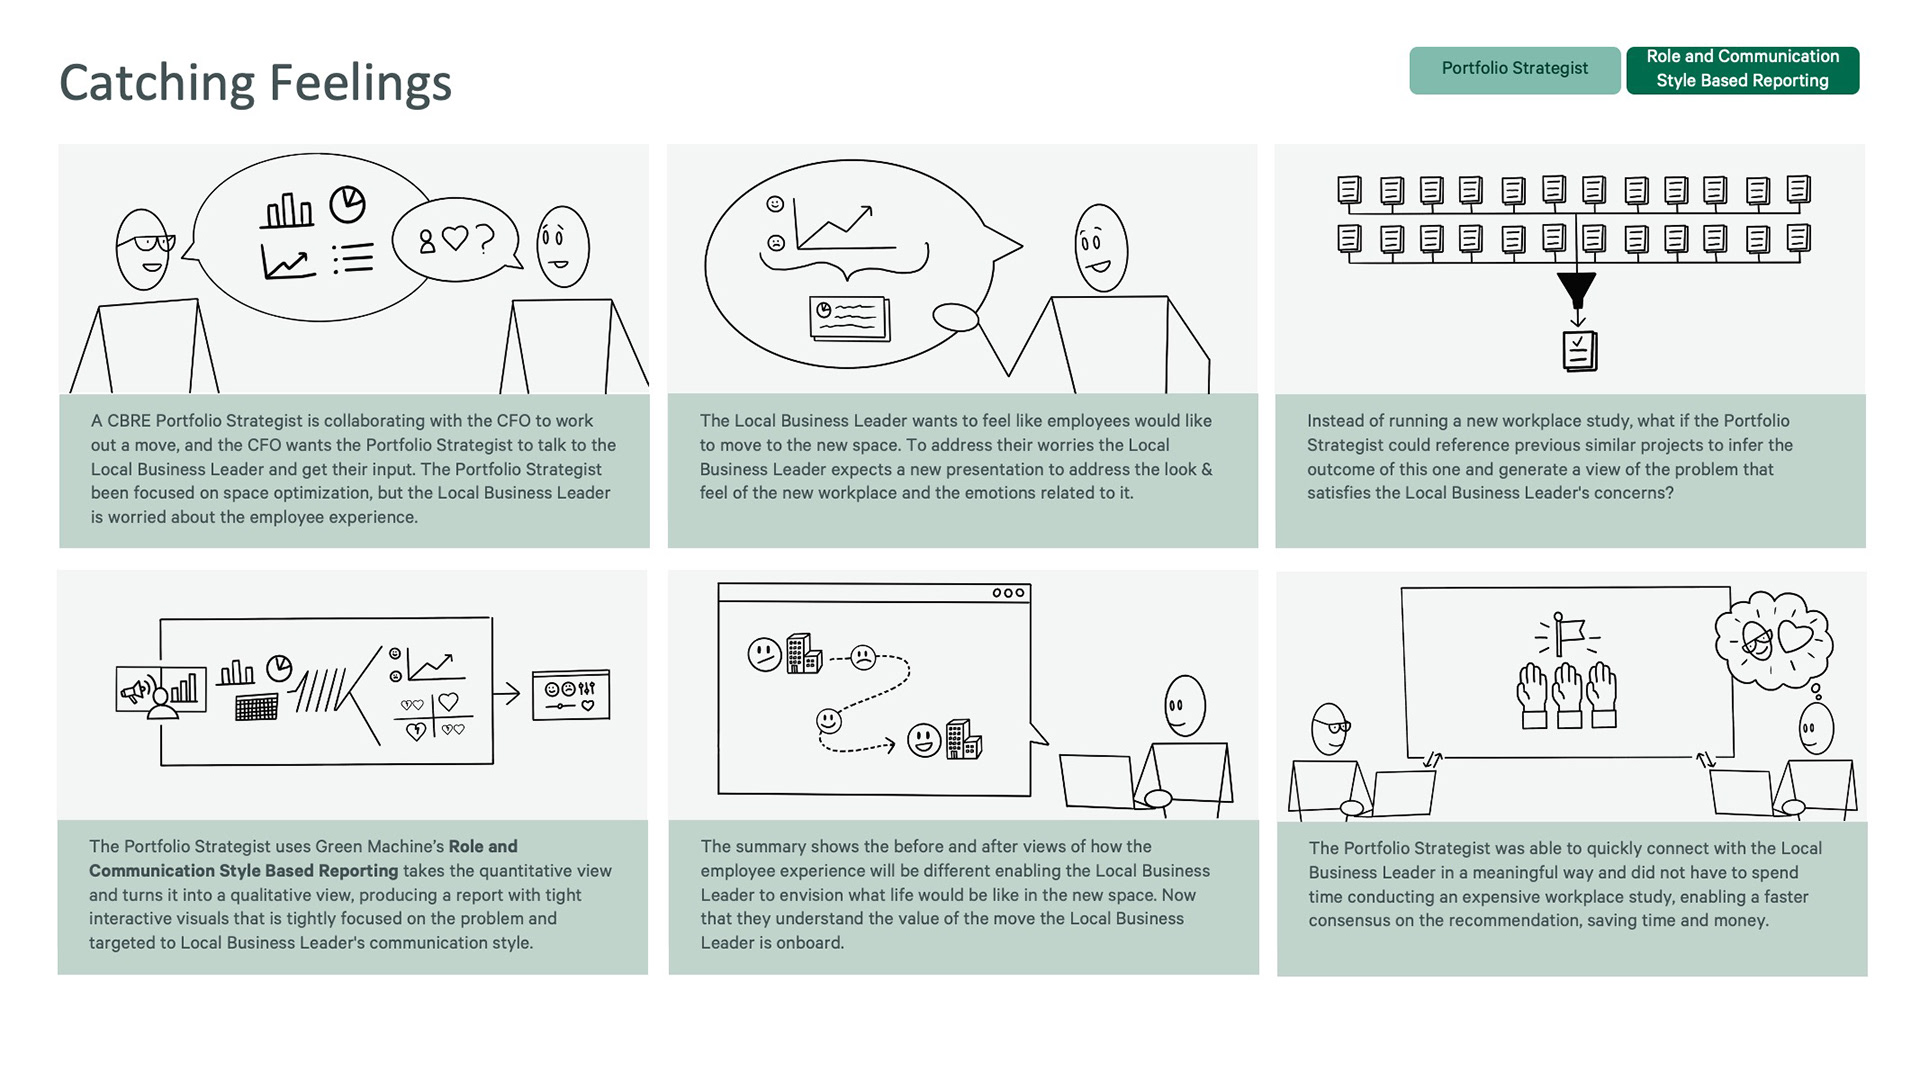
• Team members rarely collaborate when creating and presenting a Real Estate Strategy to clients, leading to unaligned client presentations.
• Teams don’t showcase enough of the data and decisions that inform their recommendations to make clients feel comfortable.
• These all culminated in the team looking inept in front of clients and time-crunched strategy revisions.
2. Understanding Users

Understanding how people would use the Enterprise Real Estate Strategy app was vital for creating the product roadmap.
When I joined the project, no business artifacts detailed the users' identities or articulated use cases for why or how they would use the product.
We created 16 realistic user scenarios and 12 core product features that drove alignment and identified the need to create personas.
• Business Stakeholders had great ideas but were too high-level and lacked details.
• The Product Team building the application were not subject matter experts and needed concepts thoroughly explained.
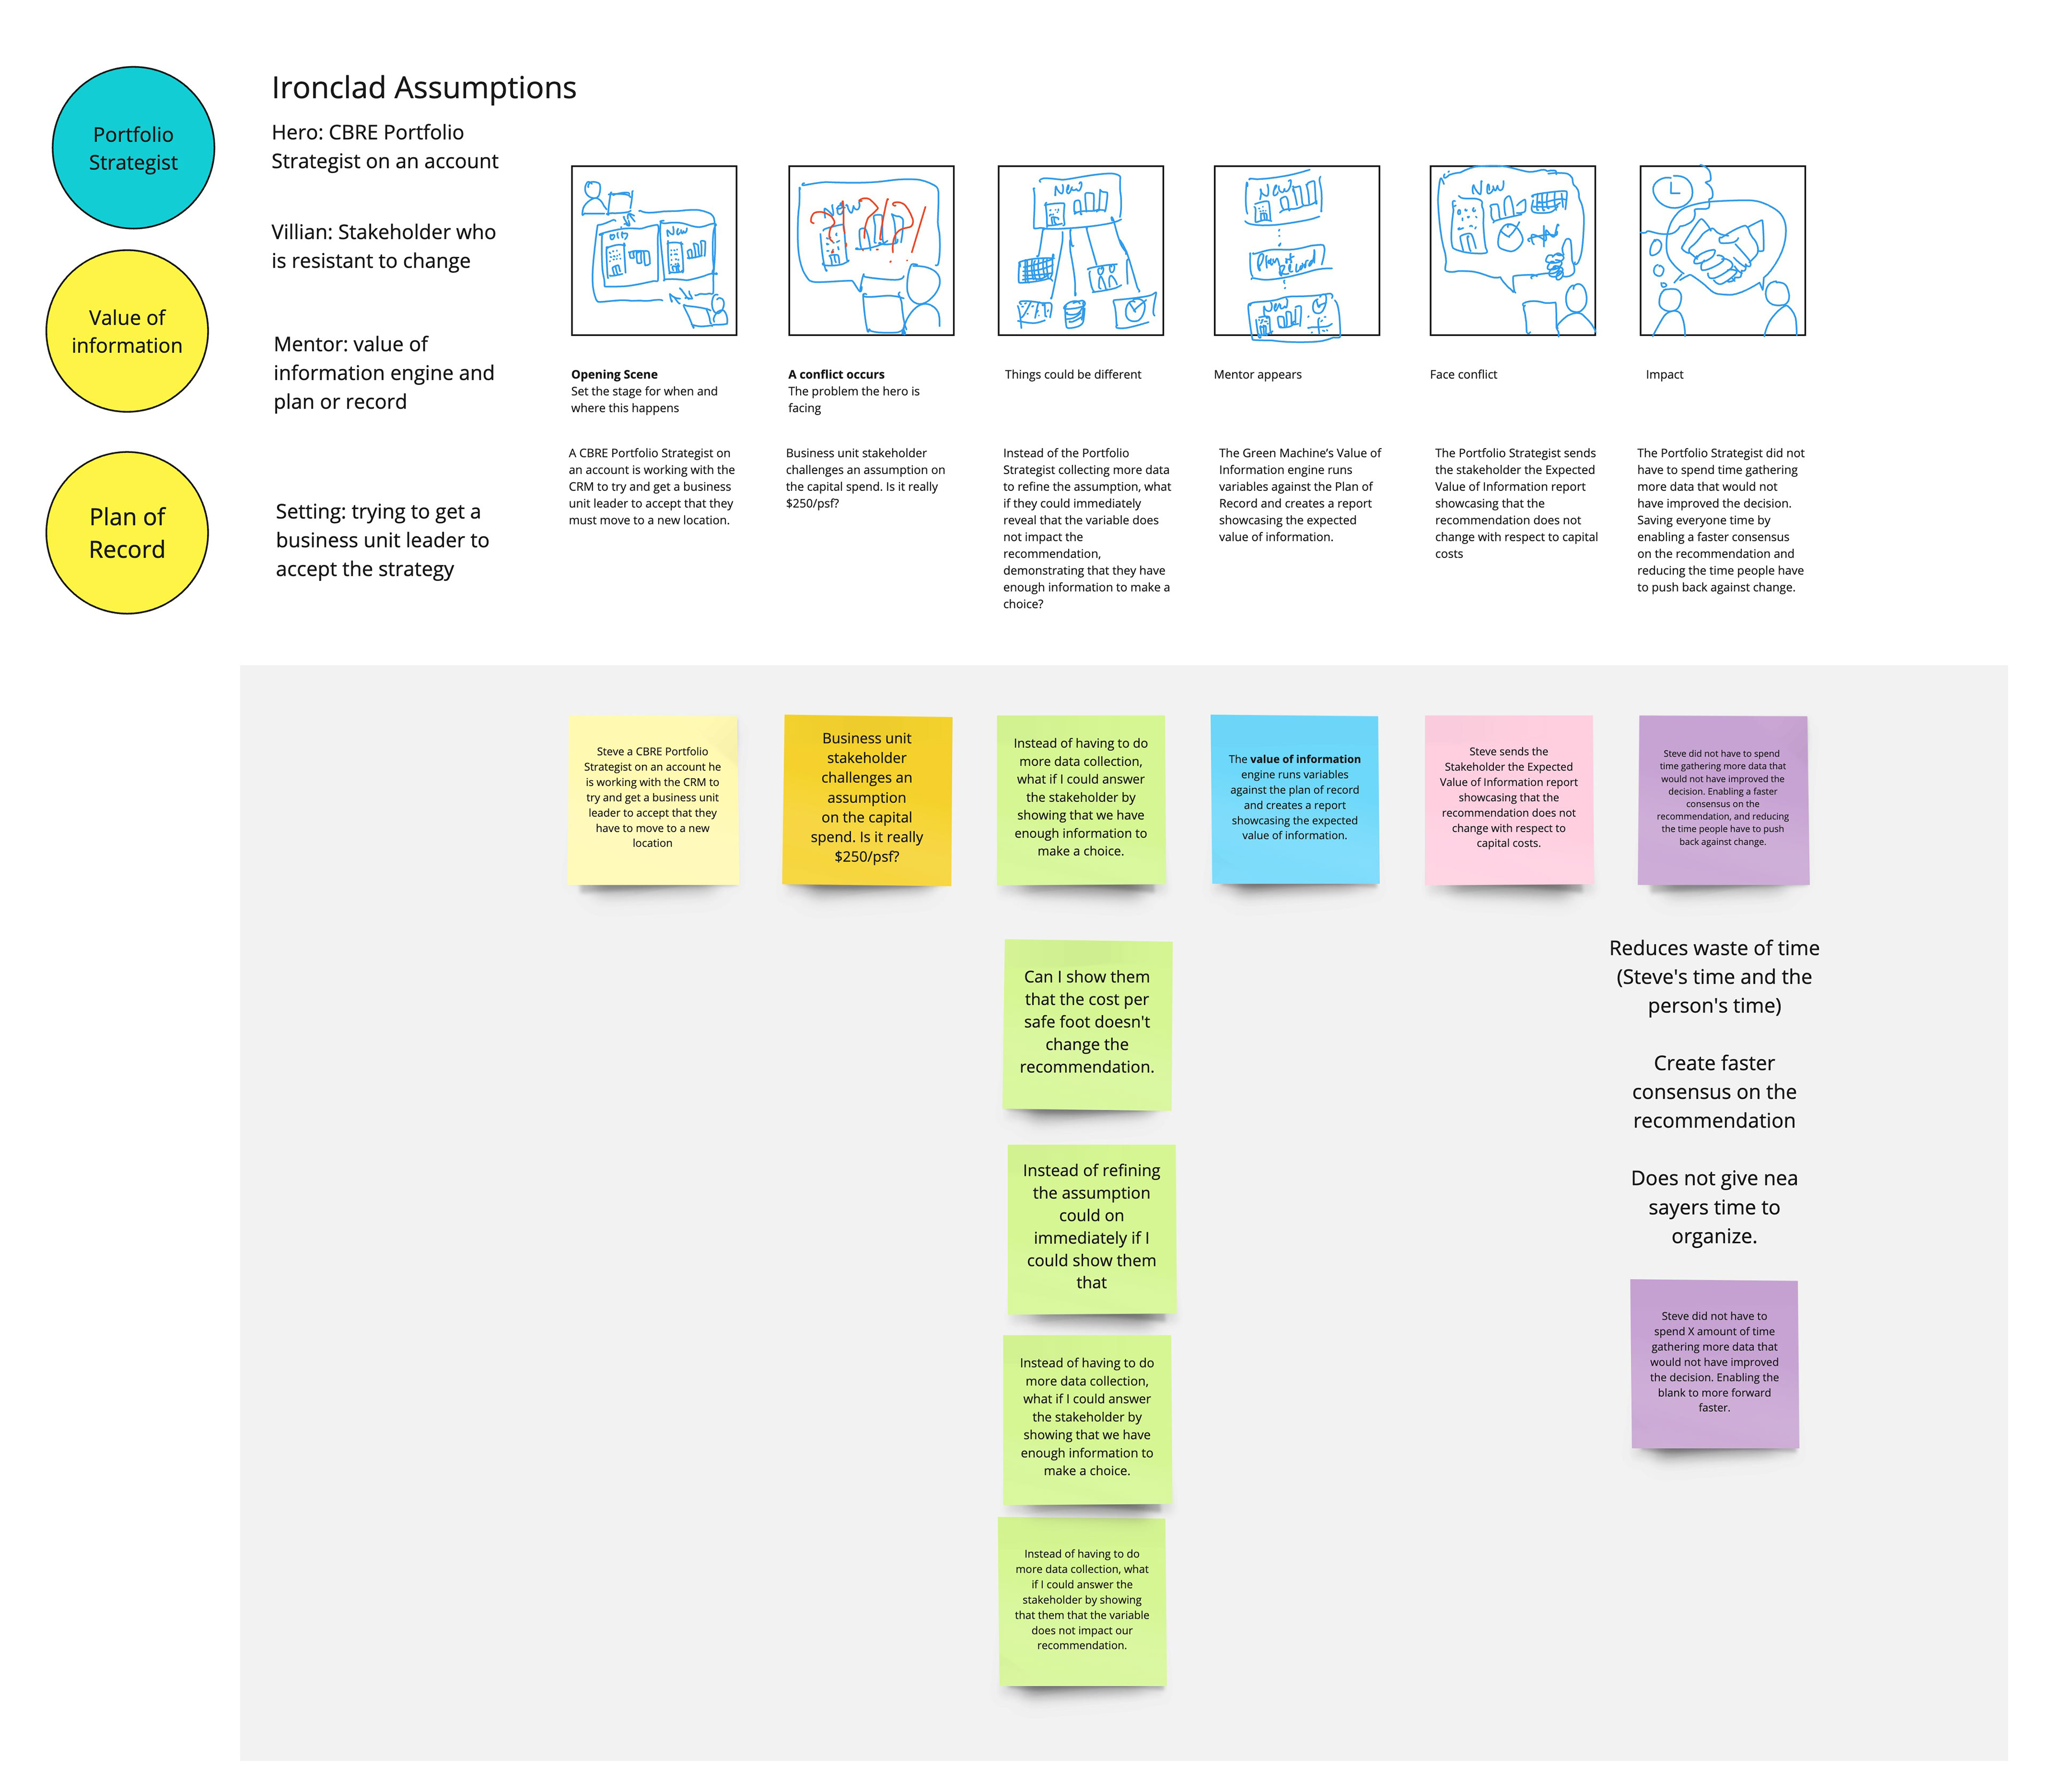
• Storyboarding to create user scenarios could bridge the knowledge gap. I planned multiple cross-functional collaboration sessions to create them.
• I facilitated the sessions through Microsoft Teams and Miro, where we used a storyboard template to create user scenarios collaboratively.
• The Business Stakeholders and Product Team now had realistic examples to drive alignment conversations and understand how the applicant would function.
We created narratives representing 16 realistic user scenarios and 12 core concepts that drove alignment and identified the need to create personas.
• The Primary Business Stakeholder now had a structured way to discuss feature expectations and requirements with the Engineering team and business partners.
• The Product Managers had a basis to start from when developing the data science team’s user stories.
• The Data Science team had more context for how the application would function.
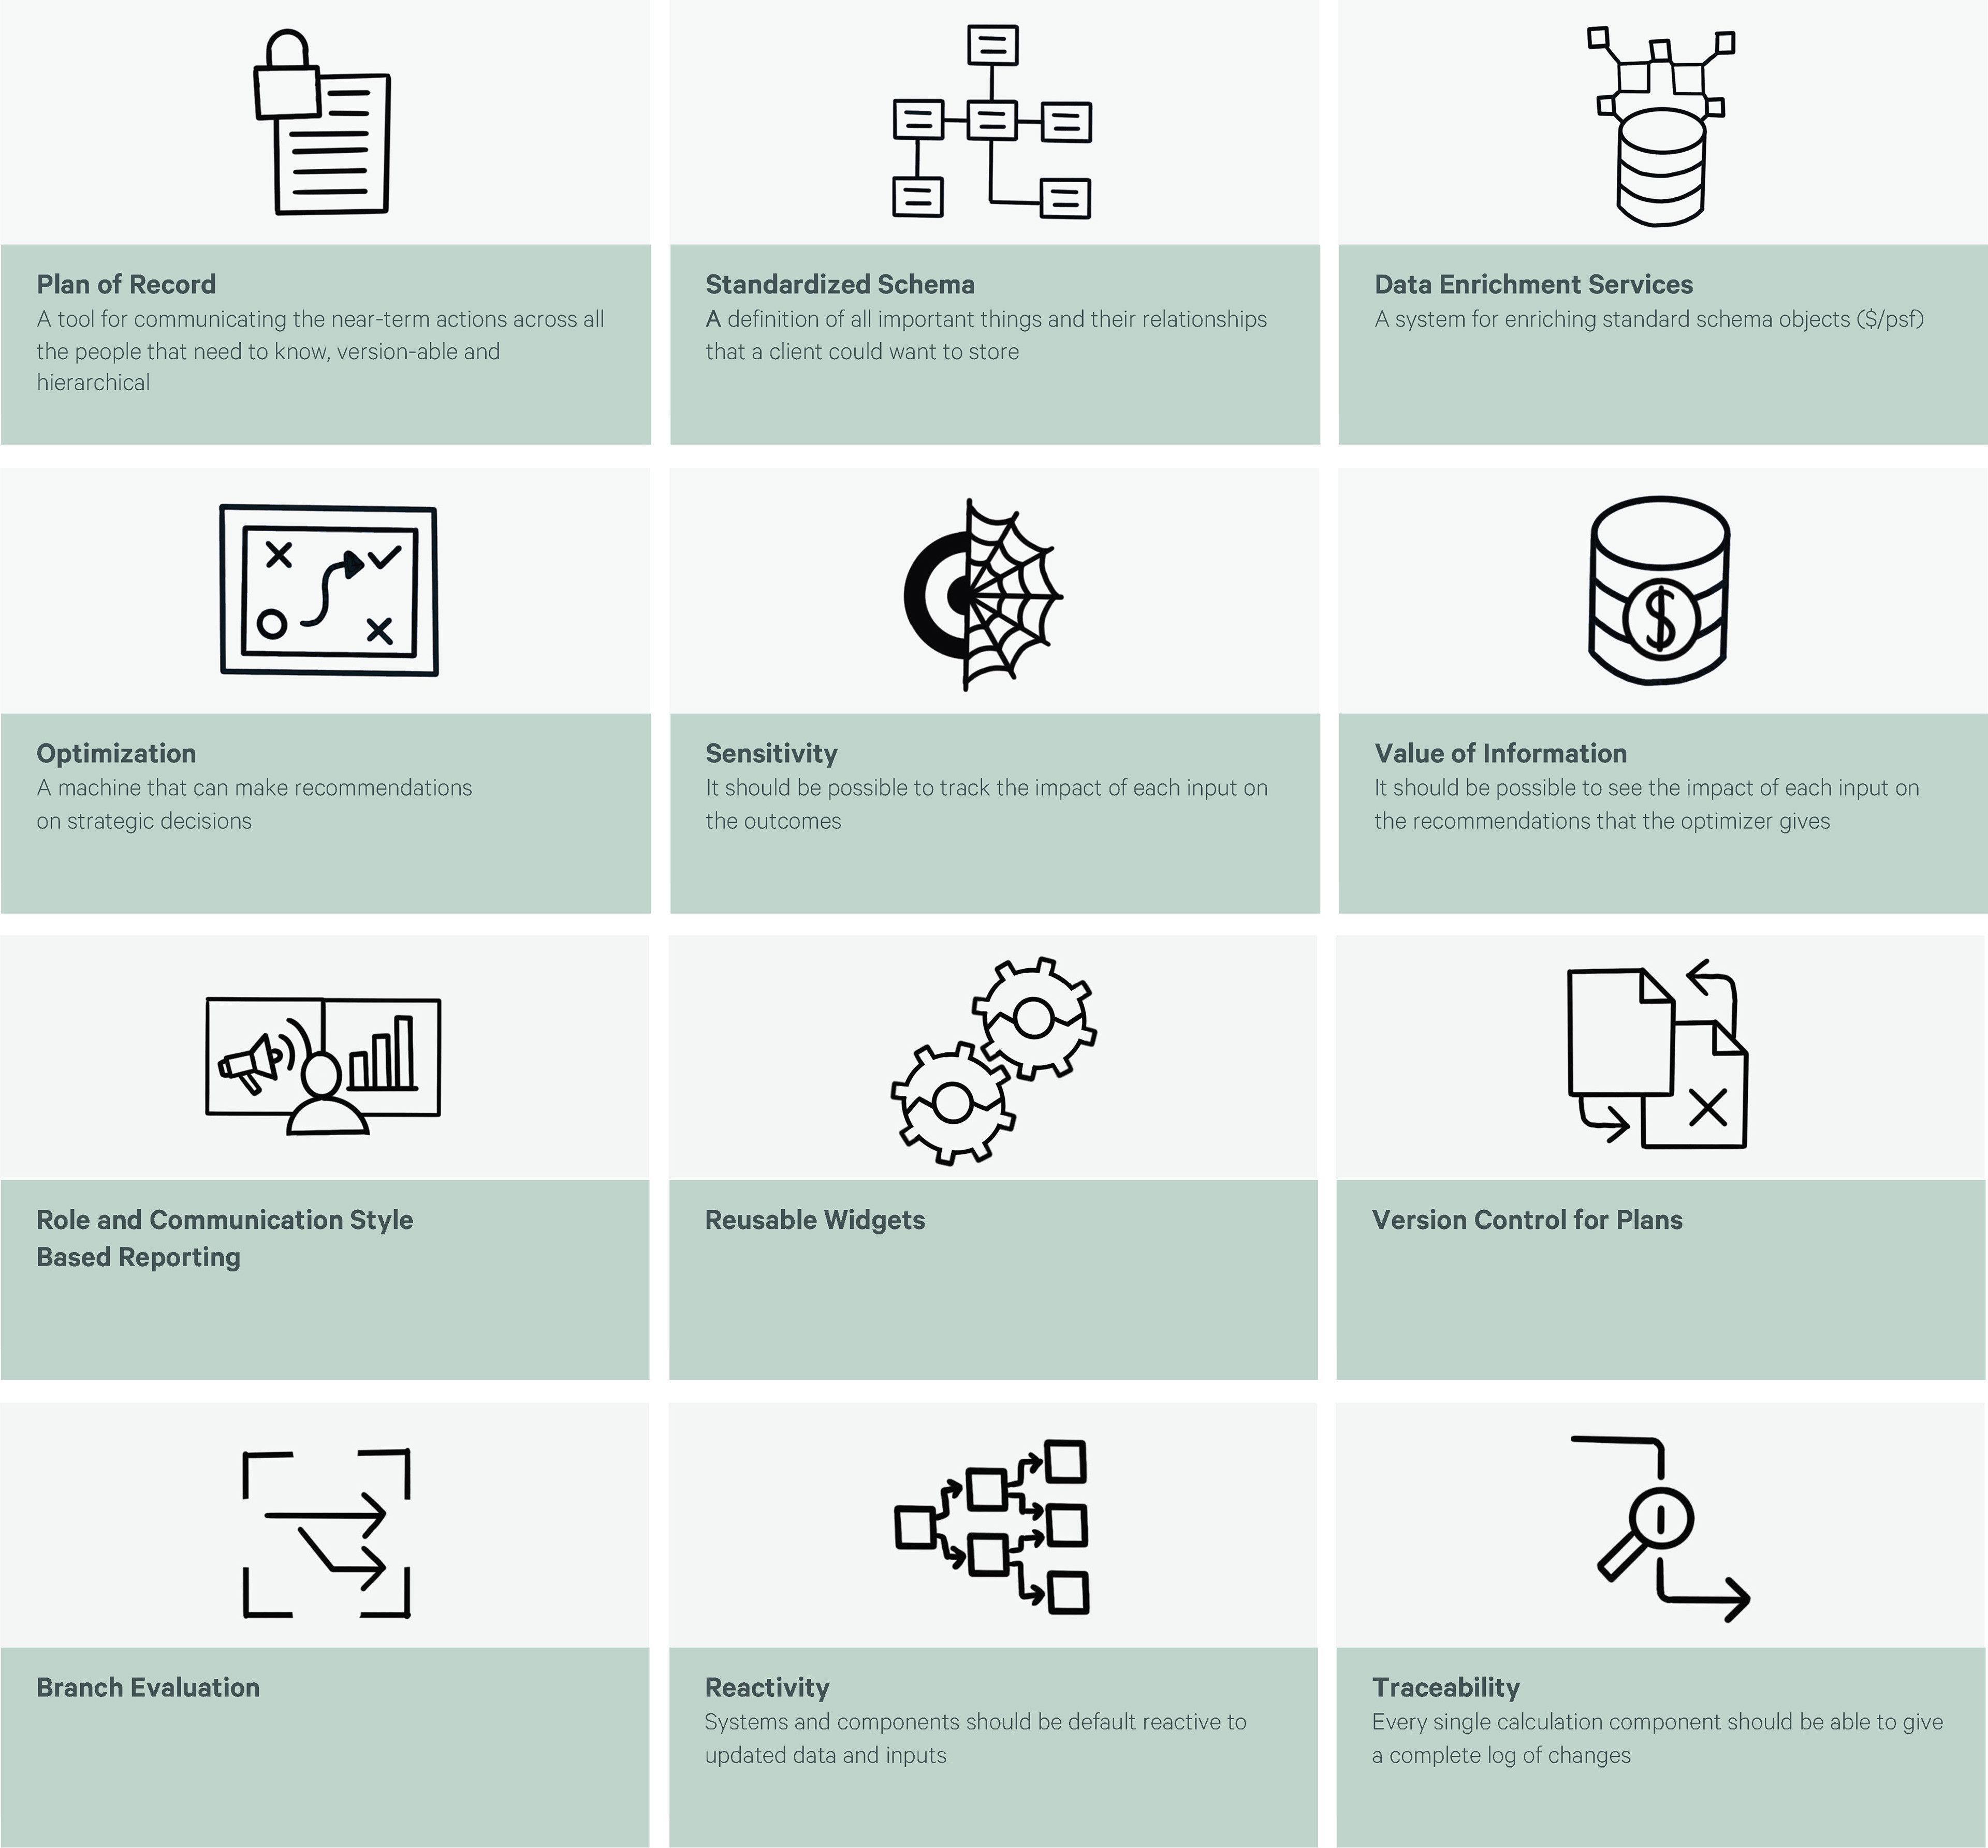
Core Concepts
I completed 4 Product Strategy Maker-focused storyboards that helped the business secure pilot partnerships with 2 clients.
• Product leadership decided we did not need 16 storyboards but a select few for the Primary Business Stakeholders to use when trying to secure pilot funding.
• The Primary Business Stakeholder identified stories they knew would resonate with clients.
• I needed to help the Primary Business Stakeholder identify the user scenarios that resonate with clients and complete the storyboards.
• I created 4 storyboards by integrating the narratives, core concepts, and personas.
I led cross-functional persona workshops identifying 3 core-user types and 4 insights that confirmed the Green Machine as a market opportunity.
• We needed to define the user types so the Data Science and Engineering team could understand the needs driving requirements.
• Persona Workshops would identify our core users and fill in details about them. I planned multiple cross-functional workshops to create them.
• The workshops included the product team, user representatives, and business stakeholders as participants.
• I facilitated the sessions through Microsoft Teams and Miro, where we identified similar user roles to create and define personas.
• I validated the personas with additional user representatives after the workshops.
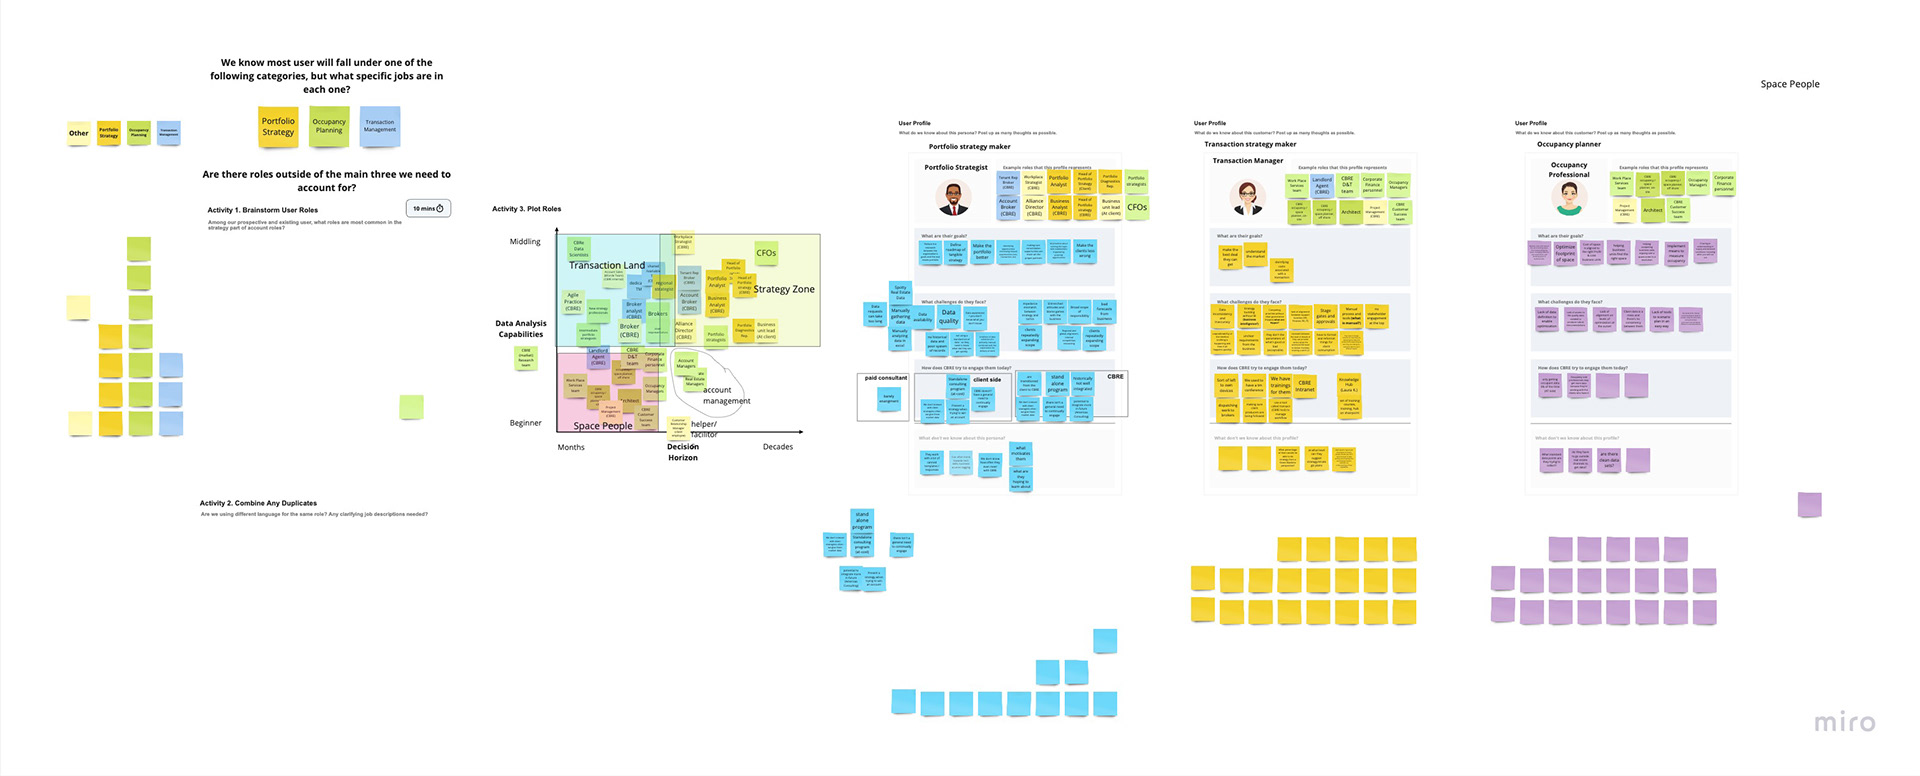
Personas
• Portfolio Strategy Maker
• Transaction Strategy Maker
• Occupancy Planner
Areas of Opportunity
Data cleansing and historical tracking
Data quality is always poor; time is spent cleaning it and finding old data records for comparison.
Data quality is always poor; time is spent cleaning it and finding old data records for comparison.
Strategy alignment
Teammates are not staying in sync with each other and what they’re the direction they’re taking.
Teammates are not staying in sync with each other and what they’re the direction they’re taking.
Adaptive & responsive tools
Currently, no tools available can help quickly respond to client scope or formate update requests.
Currently, no tools available can help quickly respond to client scope or formate update requests.
Providing a starting point
All strategy projects start with a data dump and little direction, creating significant ambiguity for the team.
All strategy projects start with a data dump and little direction, creating significant ambiguity for the team.
3. Gathering requirements with Story Maps

Transitioning to Story Maps led to identifying over 70% of new requirements upfront, cutting our iteration time in half and making writing Engineering User Stories easier.
• The initial process of gathering requirements through wireframe iteration made delivering production-ready wireframes extremely slow.
• The Engineering team requested more support in breaking down wireframes and prototypes into features and expected functionality.
• Story Maps supported collaboratively gathering requirements relatively quickly. As needed, I scheduled collaborative sessions with Product Managers and the Primary Business Stakeholder.
• I facilitated the sessions through Microsoft Teams and Miro, where we broke down user experiences into detailed user steps.
• The Story Maps drastically cut the time I spent iterating, enabling me to get to production-ready wireframes faster, and they became resources for writing the Engineering User Stories.
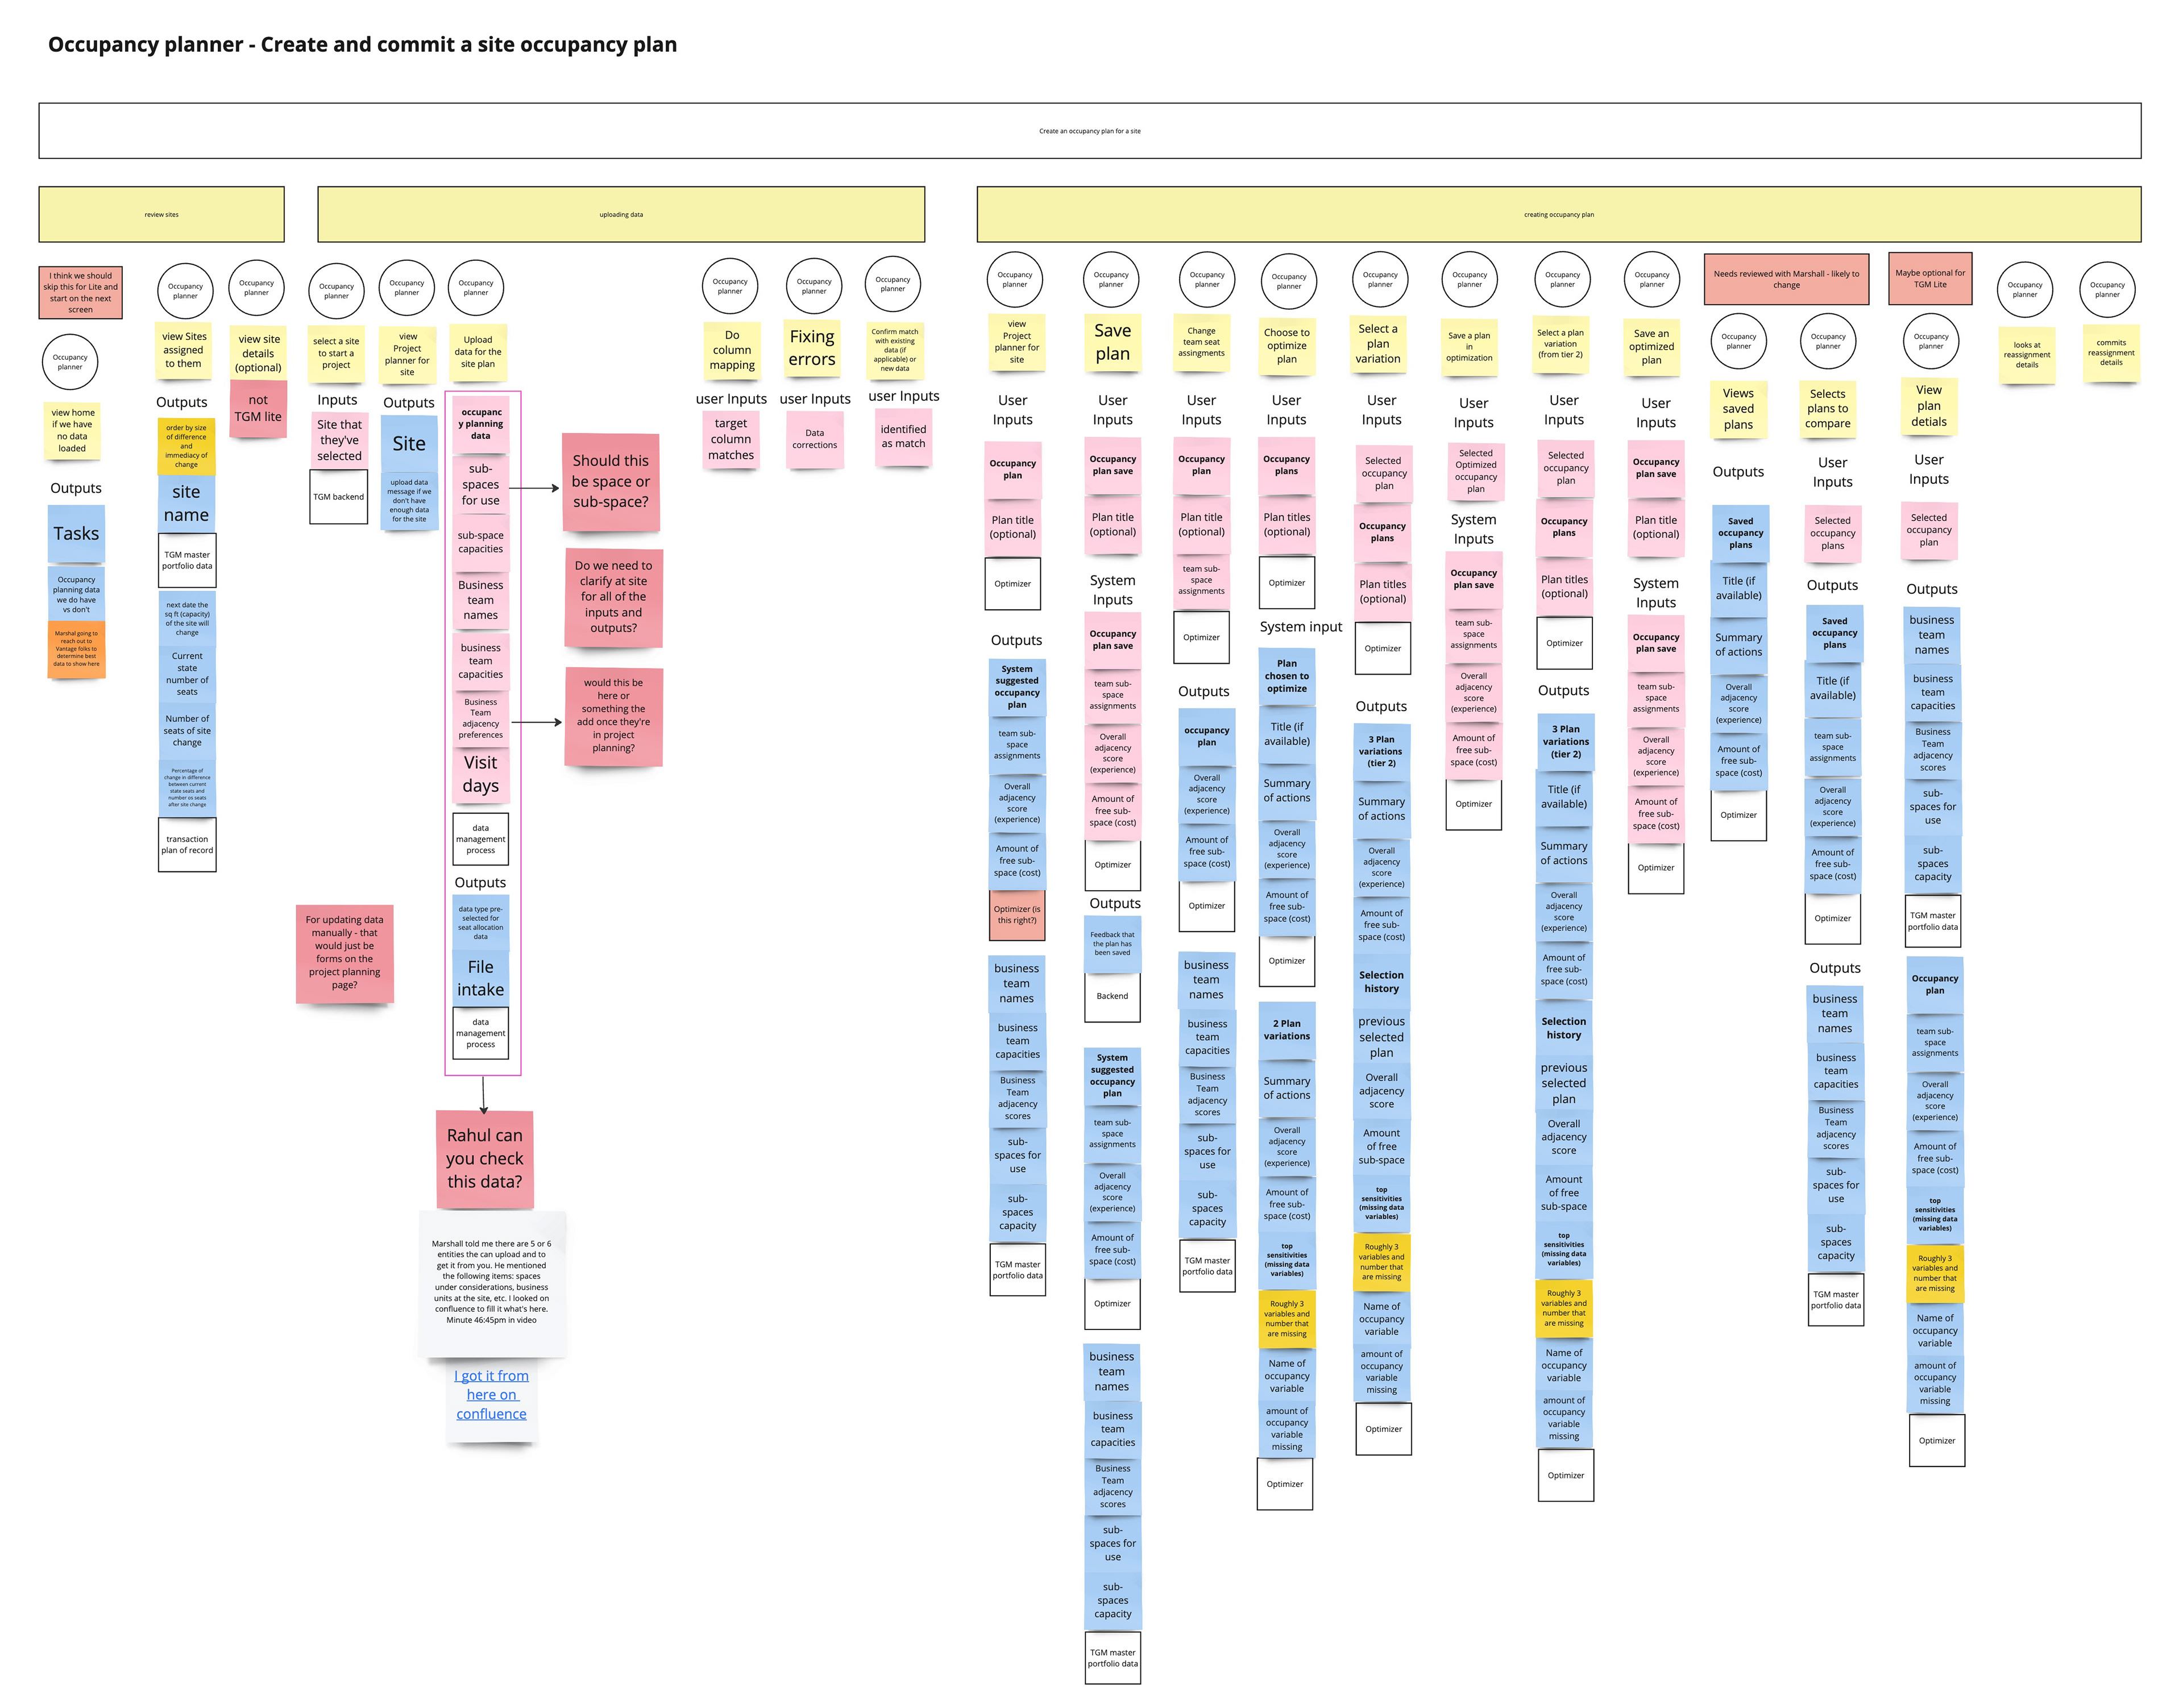
Updated Occupancy Planner Story Map
4. Validating Concepts

We validated Product Strategy Maker and Occupancy Planner flows through concept testing and uncovered some significant gaps in Occupancy Planning.
• Business Leadership had good insight but needed to validate product concepts with users.
• I created a moderated concept validation protocol testing the Product Strategy and Occupancy Planning concepts to start validating.
• I conducted the tests in Microsoft Teams with participants interacting with a Figma Prototype.
• Both concepts had a 100% validation rate across participants.
• We learned that some of our labeling choices could improve and that users were interested in how the app created suggestions and scores.
• In our Occupancy Planning experience, we uncovered significant gaps in the data points they needed to create Occupancy Plans.
5. Improving the Process

I created reusable interface patterns and improved the Story Map structure, significantly reducing the time spent developing new features.
I evolved the Story Maps structure to be more thorough and further reduce time spent iterating.
• The Story Map structure wasn’t as in-depth as it could be, which required falling back on iterating through wireframes to flesh out details.
• I needed to update the Story Map template to handle more details.
• I changed how we visualized groups of data and added a list of actions as part of the user step.
• I also incorporated validating the Story Maps with users into the process.
• Having well-organized and validated User Stories made prioritizing and executing the next feature, Transaction Strategy, less complicated by reducing time spent collecting requirements and iterating.
The hierarchy and patterns I created for Occupancy Planning served as a temple for creating the Transaction Strategy Maker experience.
• We needed to create reusable patterns and components for the product to be sustainable.
• The hierarchy I created for the Occupancy Planning experience could work for any planning flow.
• I reutilized the structure and key features of the Occupancy Planning experience and modified them to fit the Transaction Strategy experience.
• Developing the Transaction Strategy experience had the shortest time from concept to production-ready wireframes.
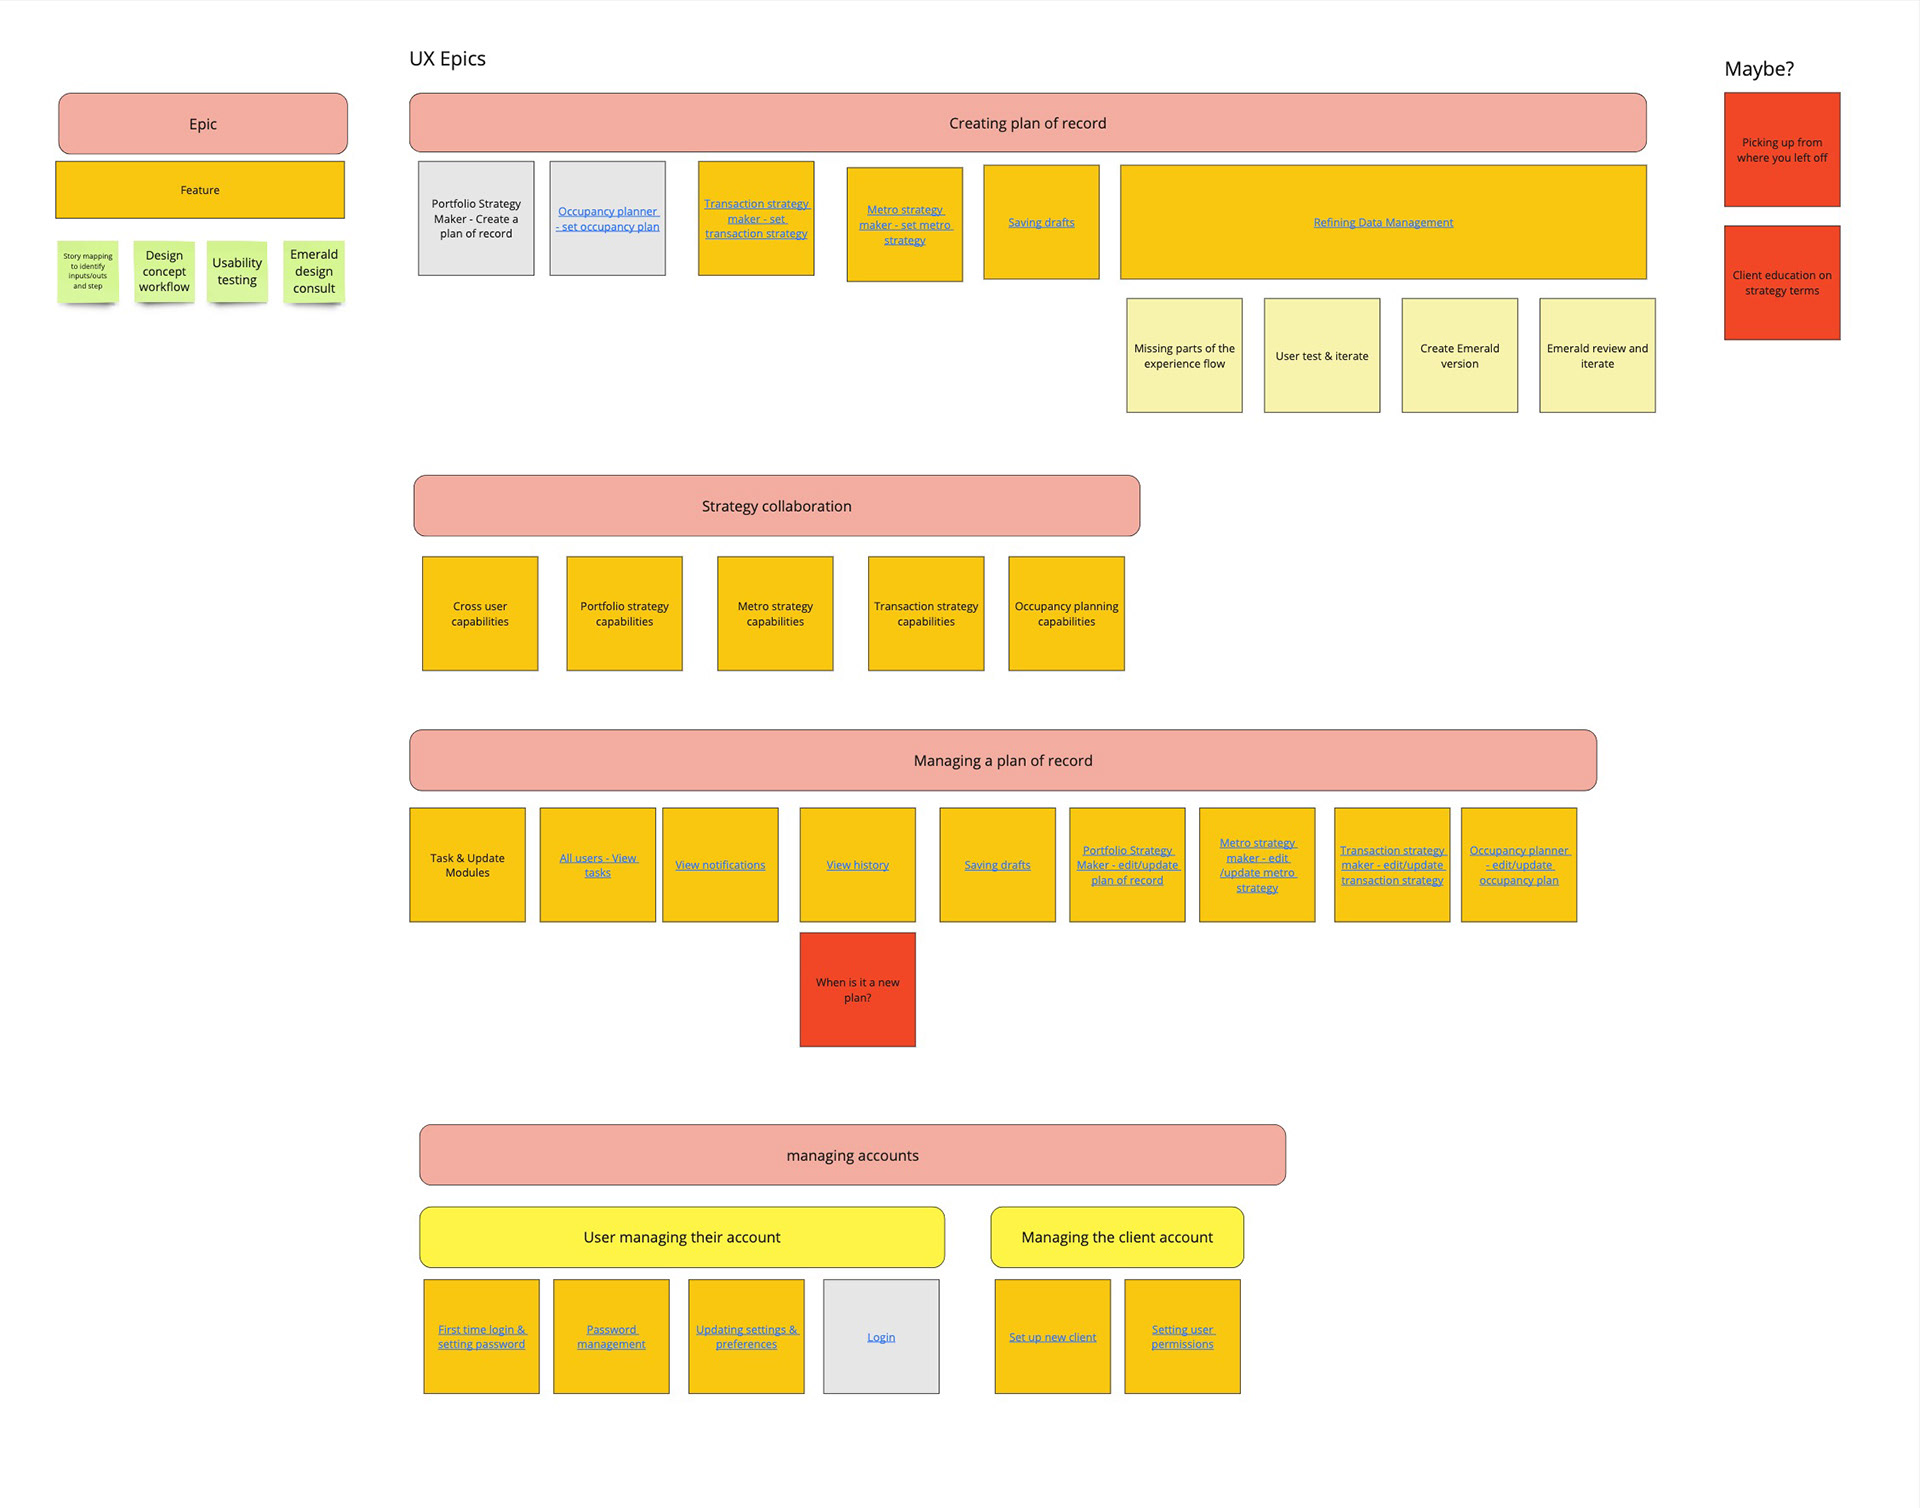
UX Epics & Features
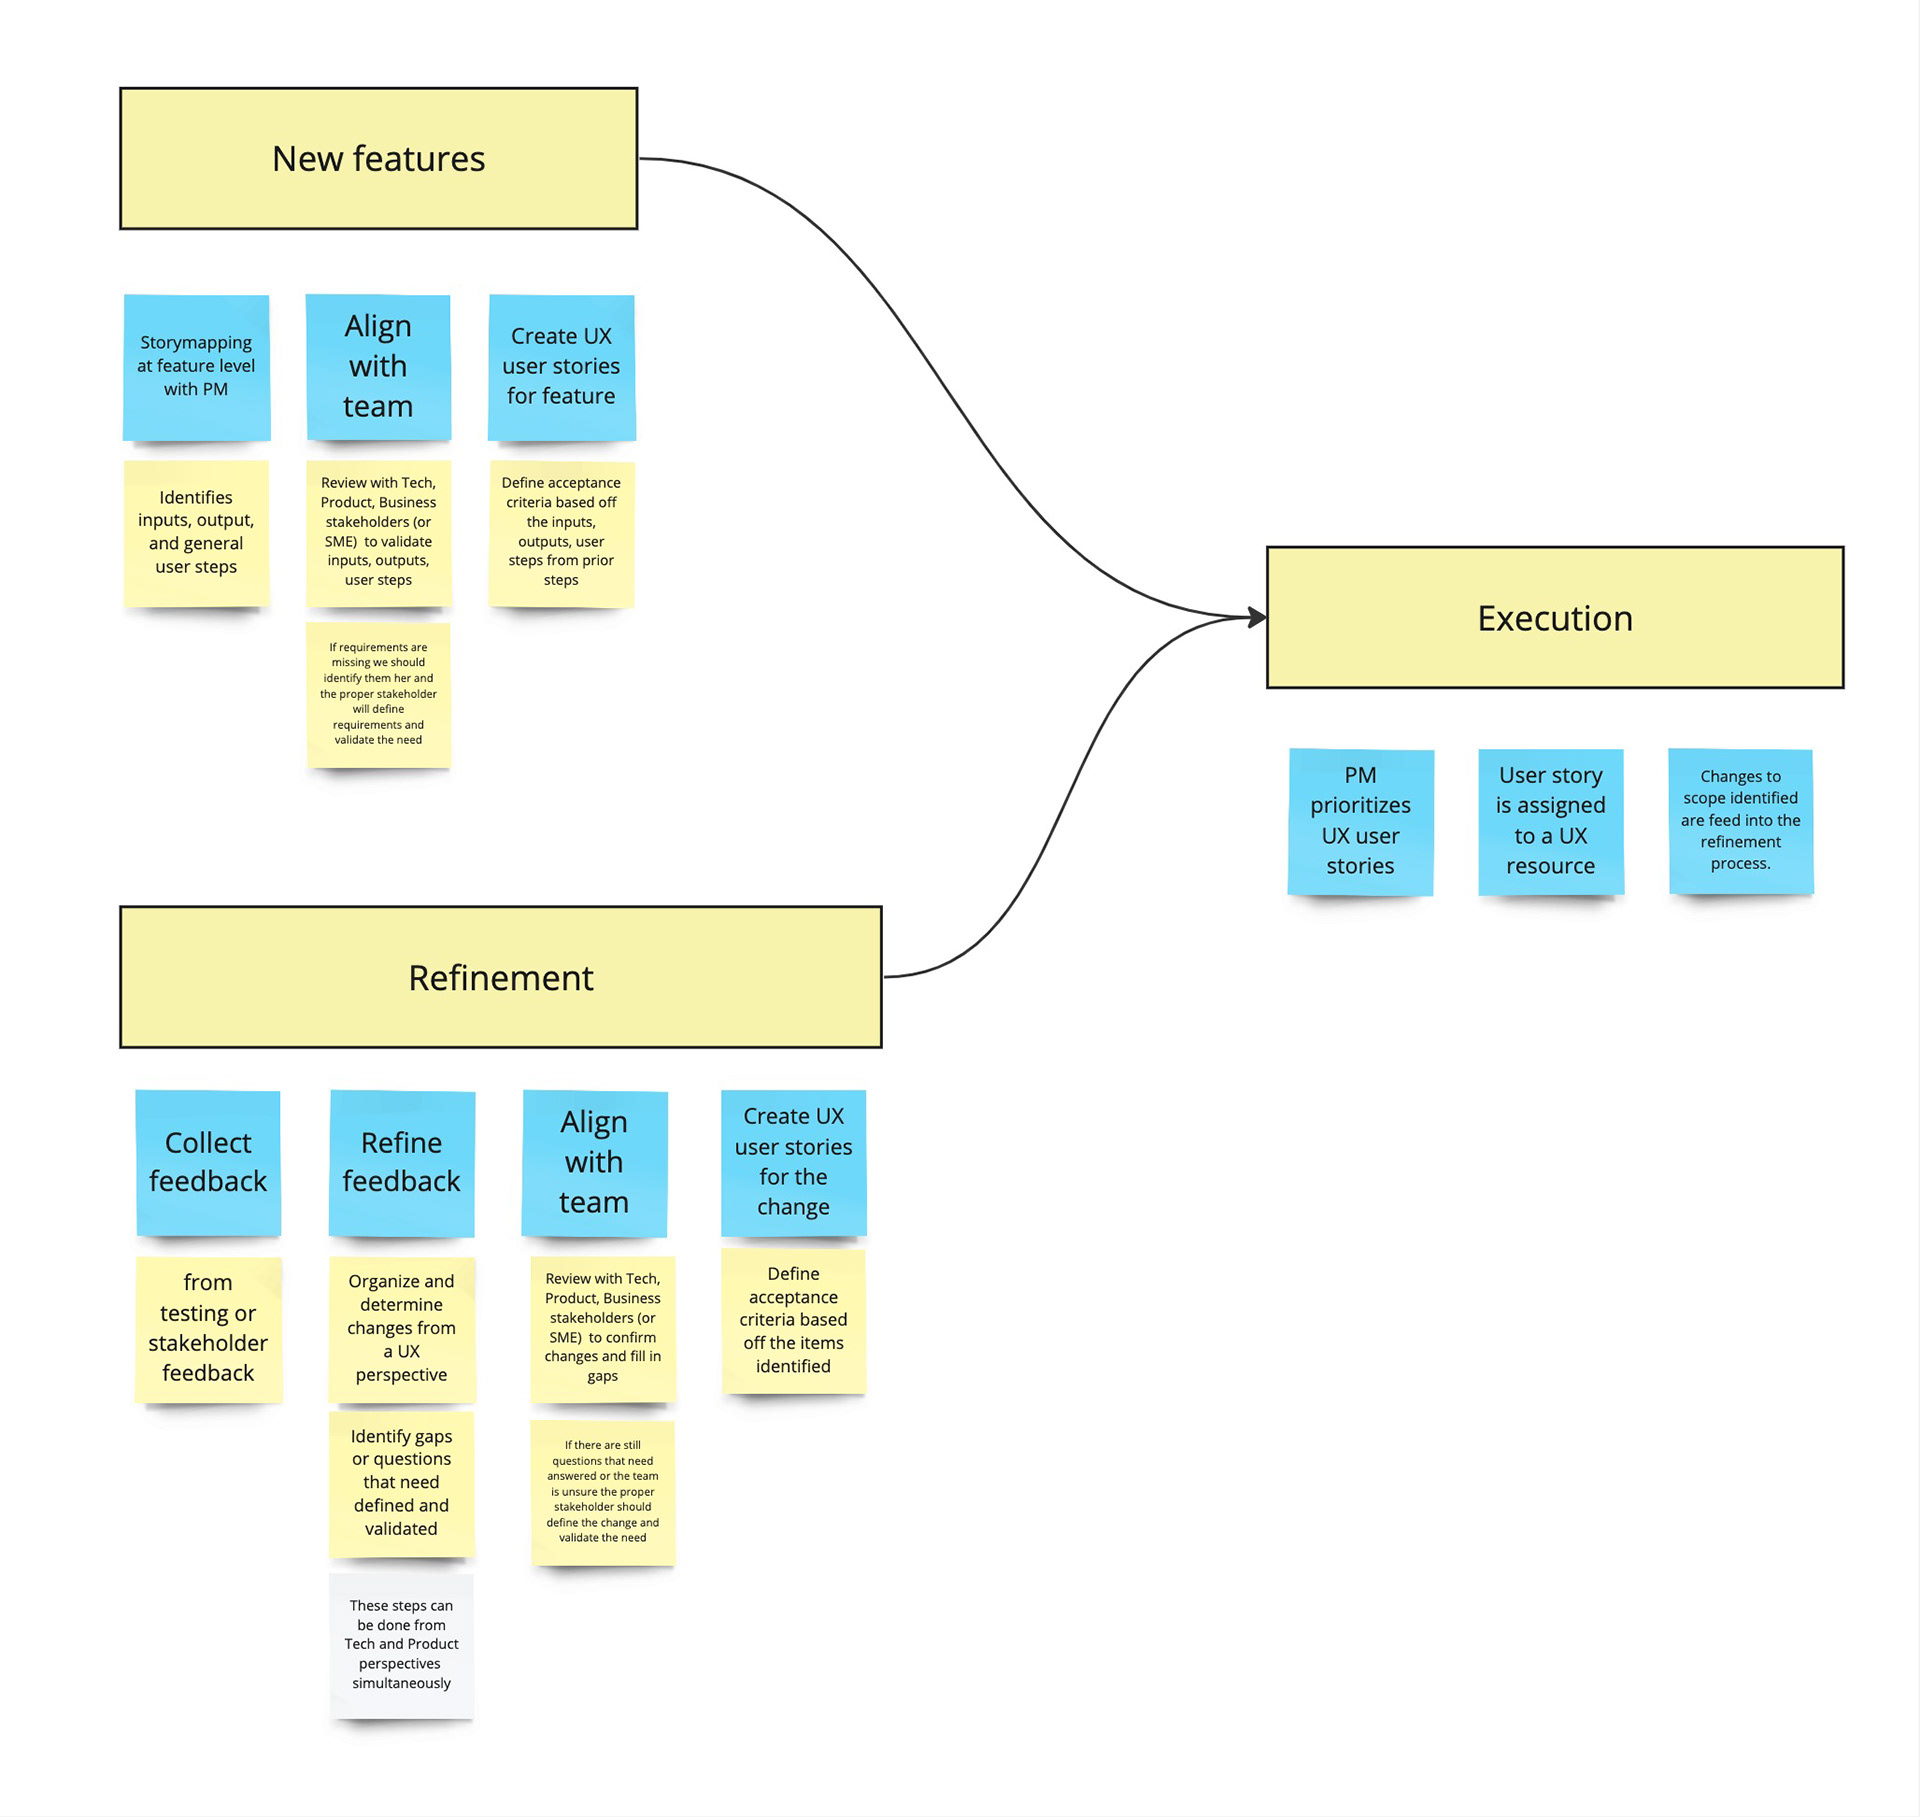
Process for handling new features & refinements
6. Experience Spotlight (wireframes)

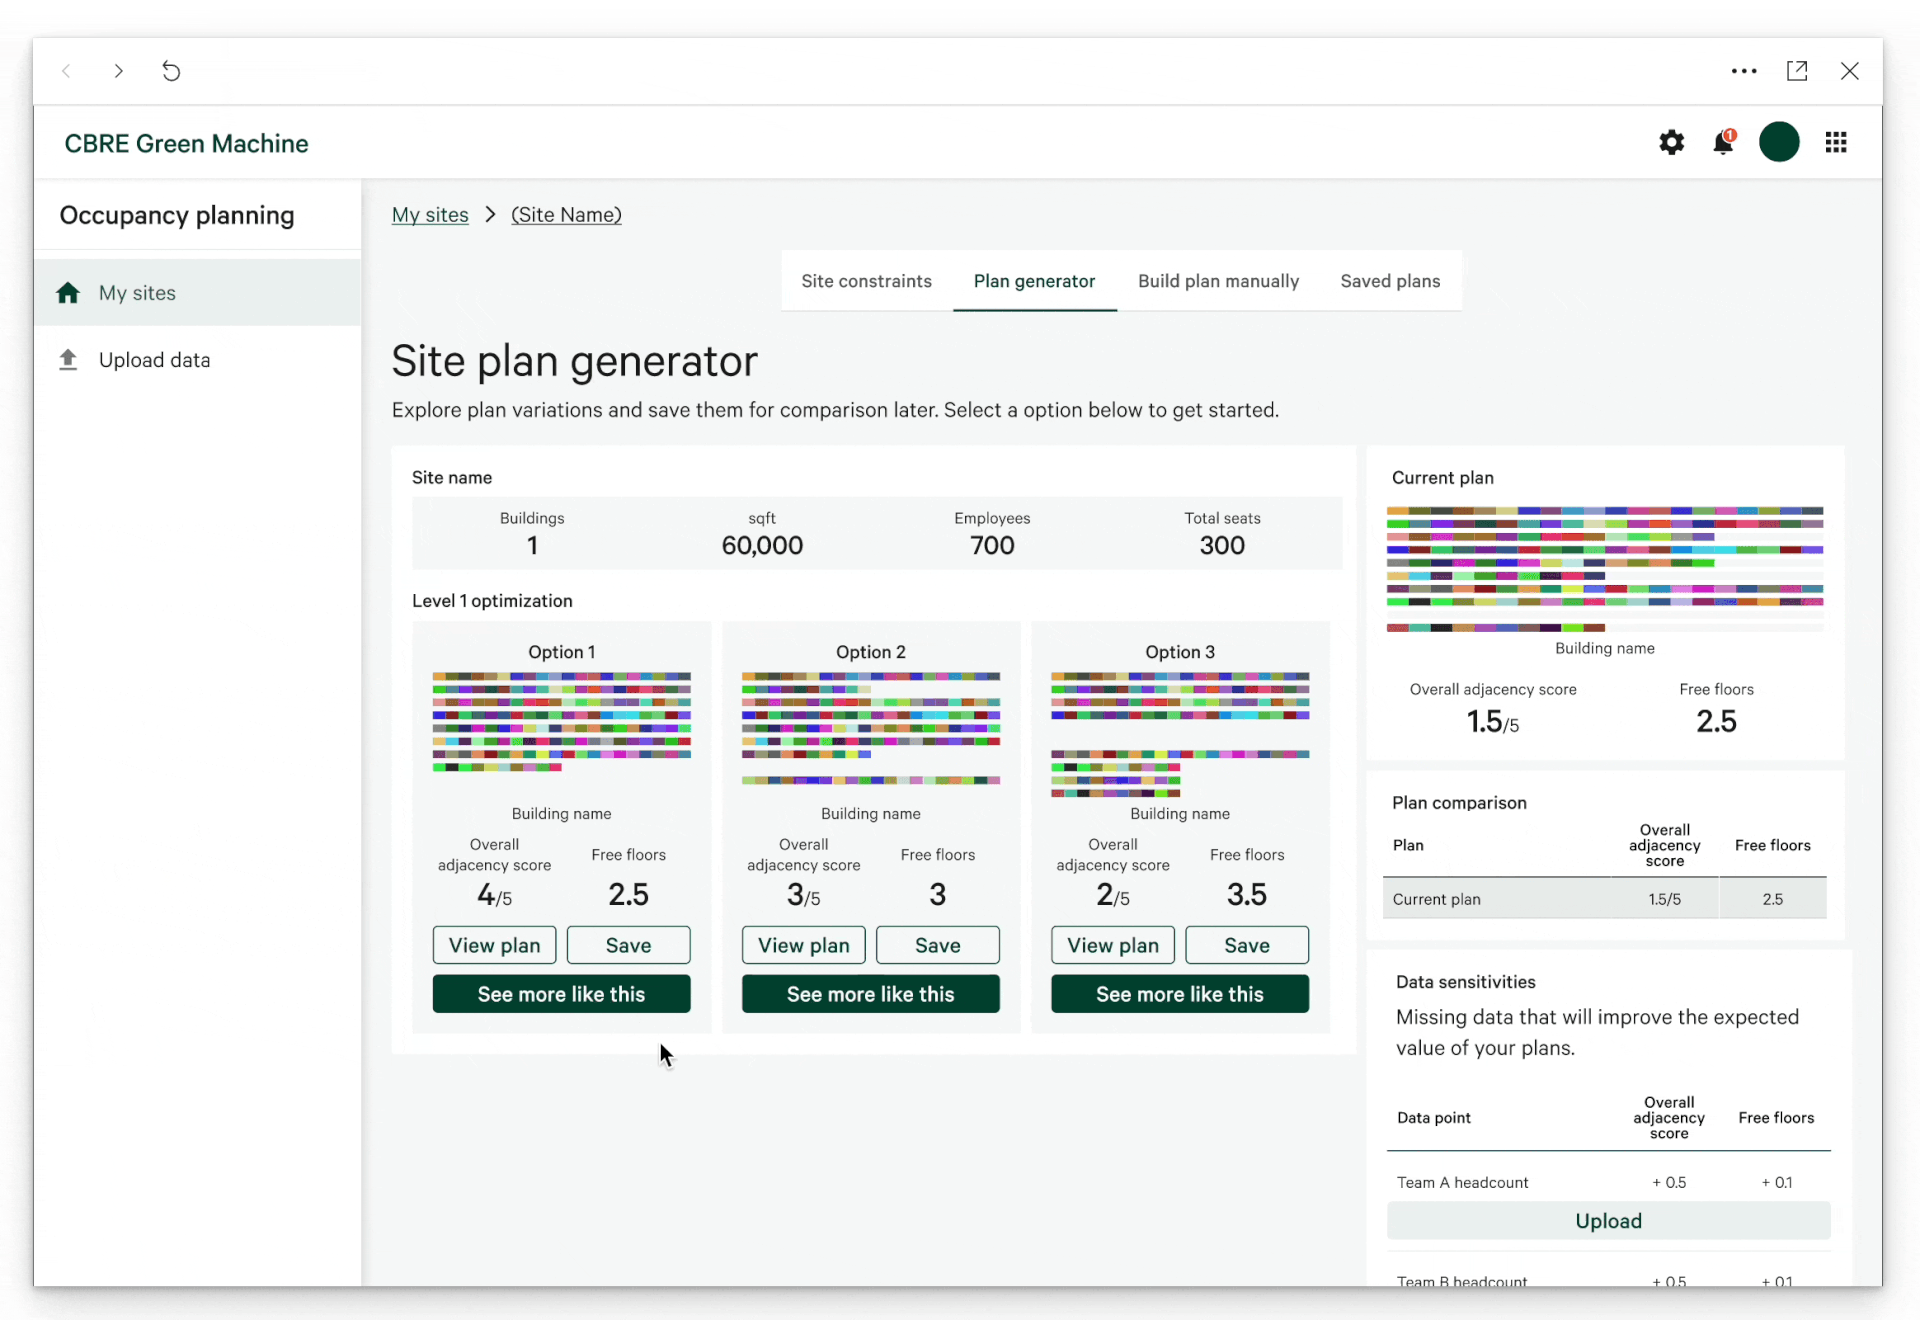
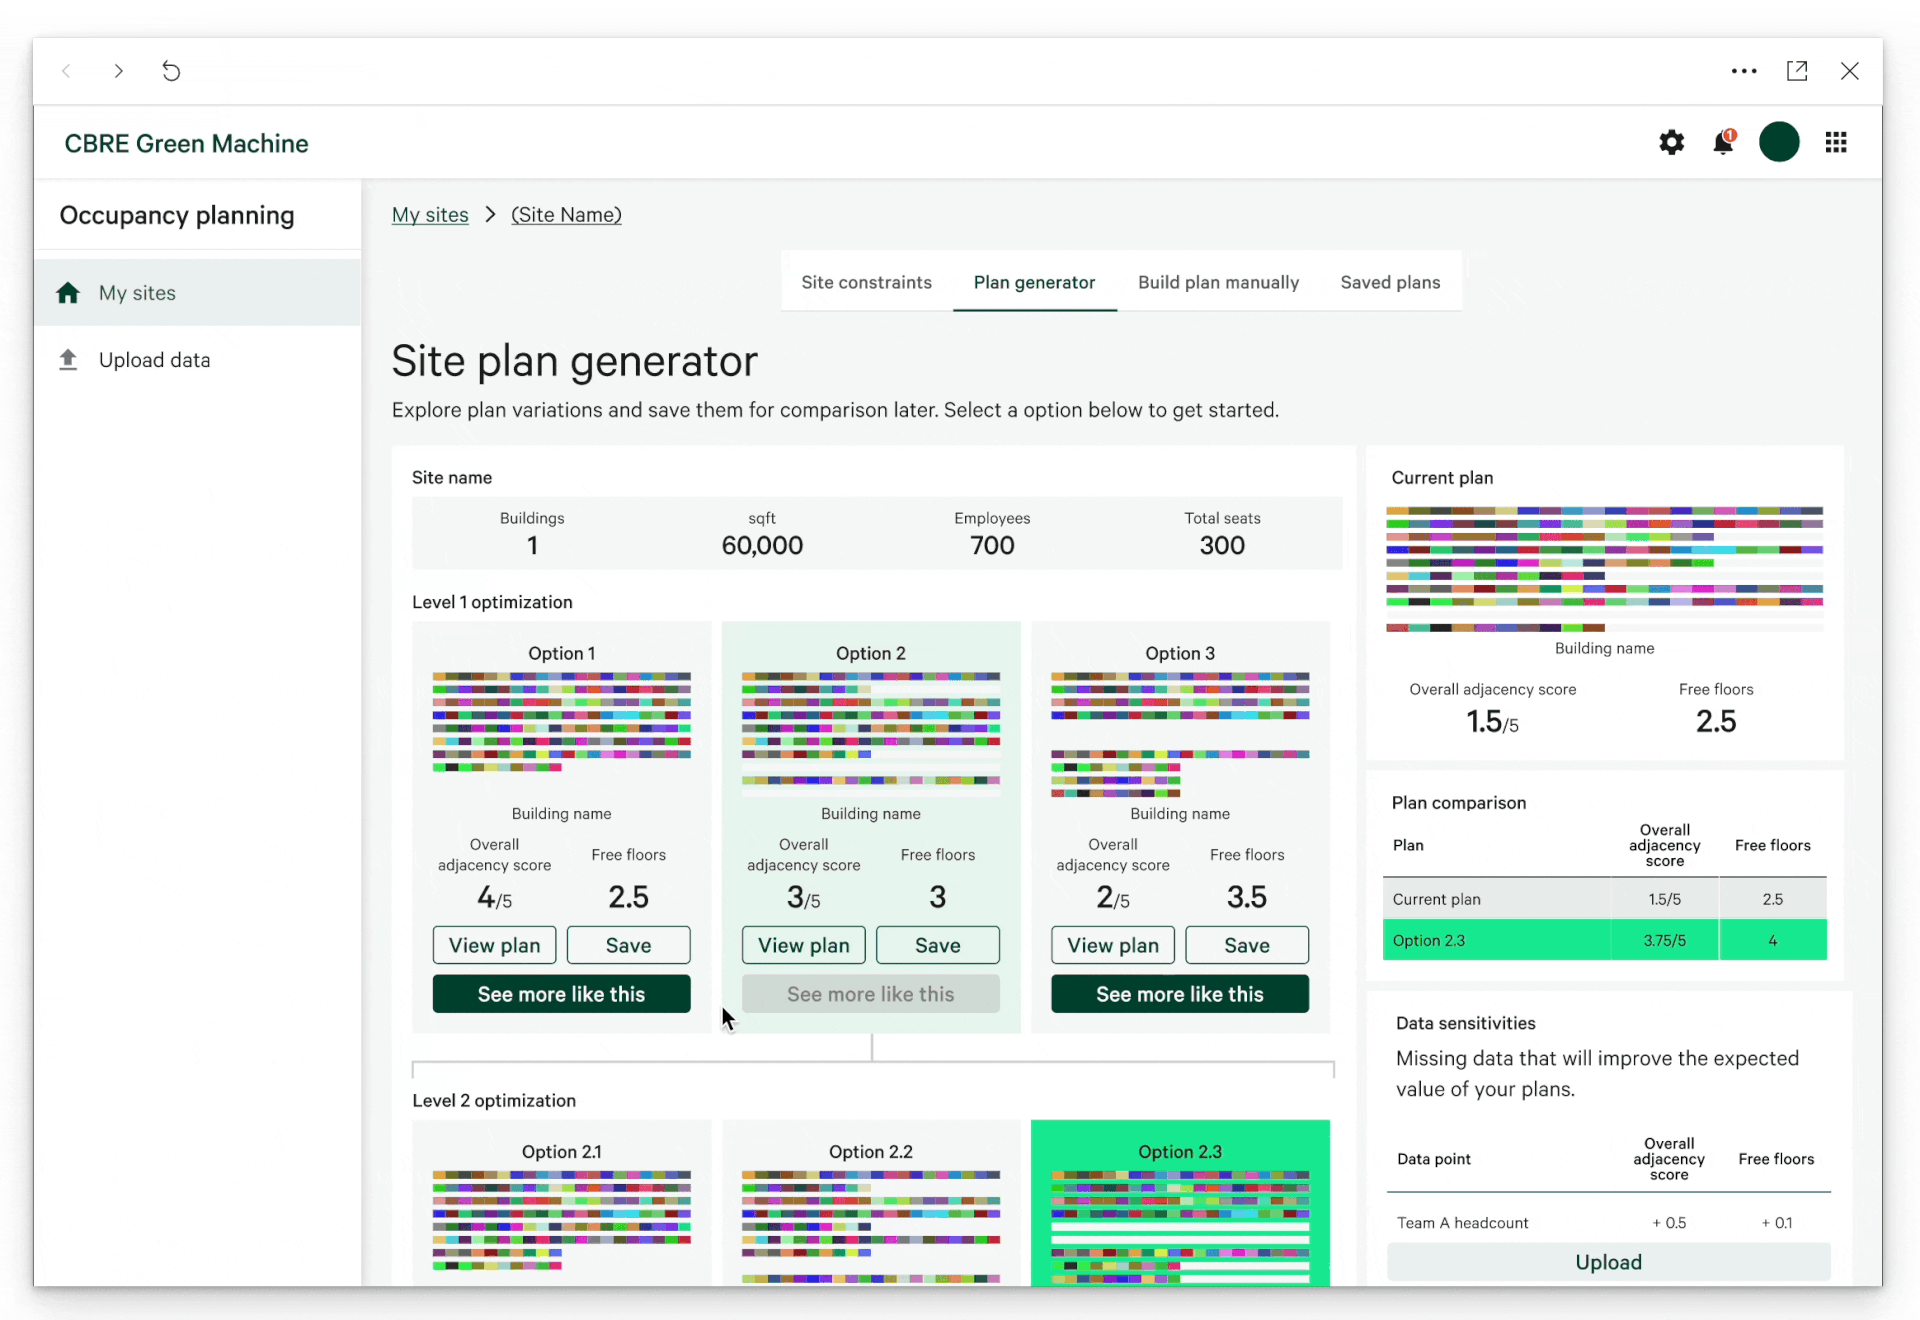
Occupancy Planners use the Enterprise Real Estate Strategy Creator to optimize the seat-to-space ratio for a site that aligns with the strategic goals.
Choosing the Site
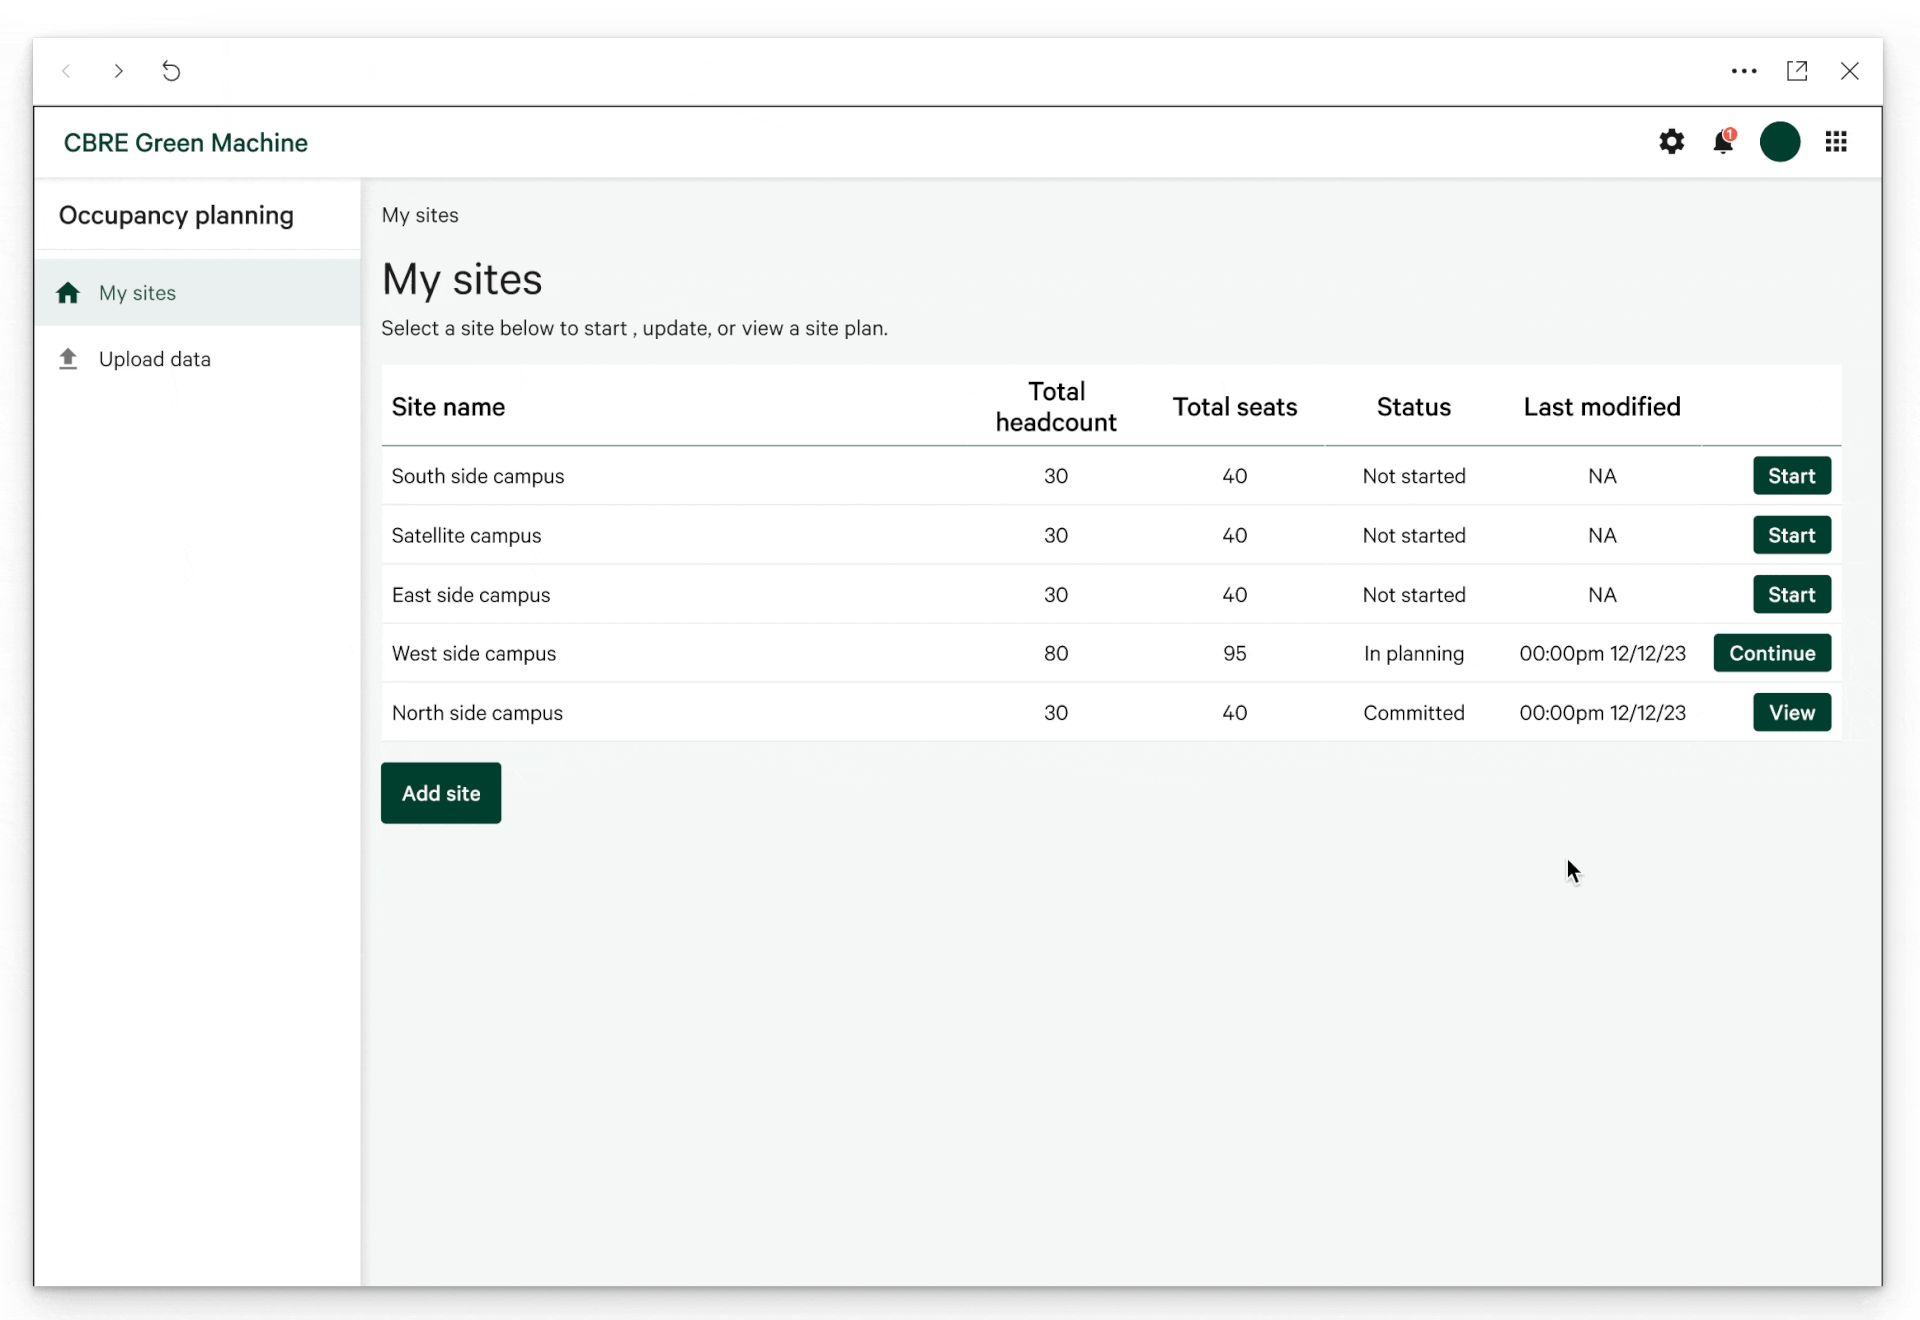
• On the My Sites page, the Occupancy Planner will choose one of the sites assigned to them to start working on.
• Then Occupancy Planners are taken to the Site Page, which has four tabs: Site Constraints, Plan Generator, Build Plan Manually, and Saved Plans.
Exploring and Viewing Plans
• Occupancy Planners will spend most of their time exploring plans through the Plan Generator to find approximations of the plans they want and go to the Plan Details page to modify them.
• Occupancy Planners can save the plans to compare later.
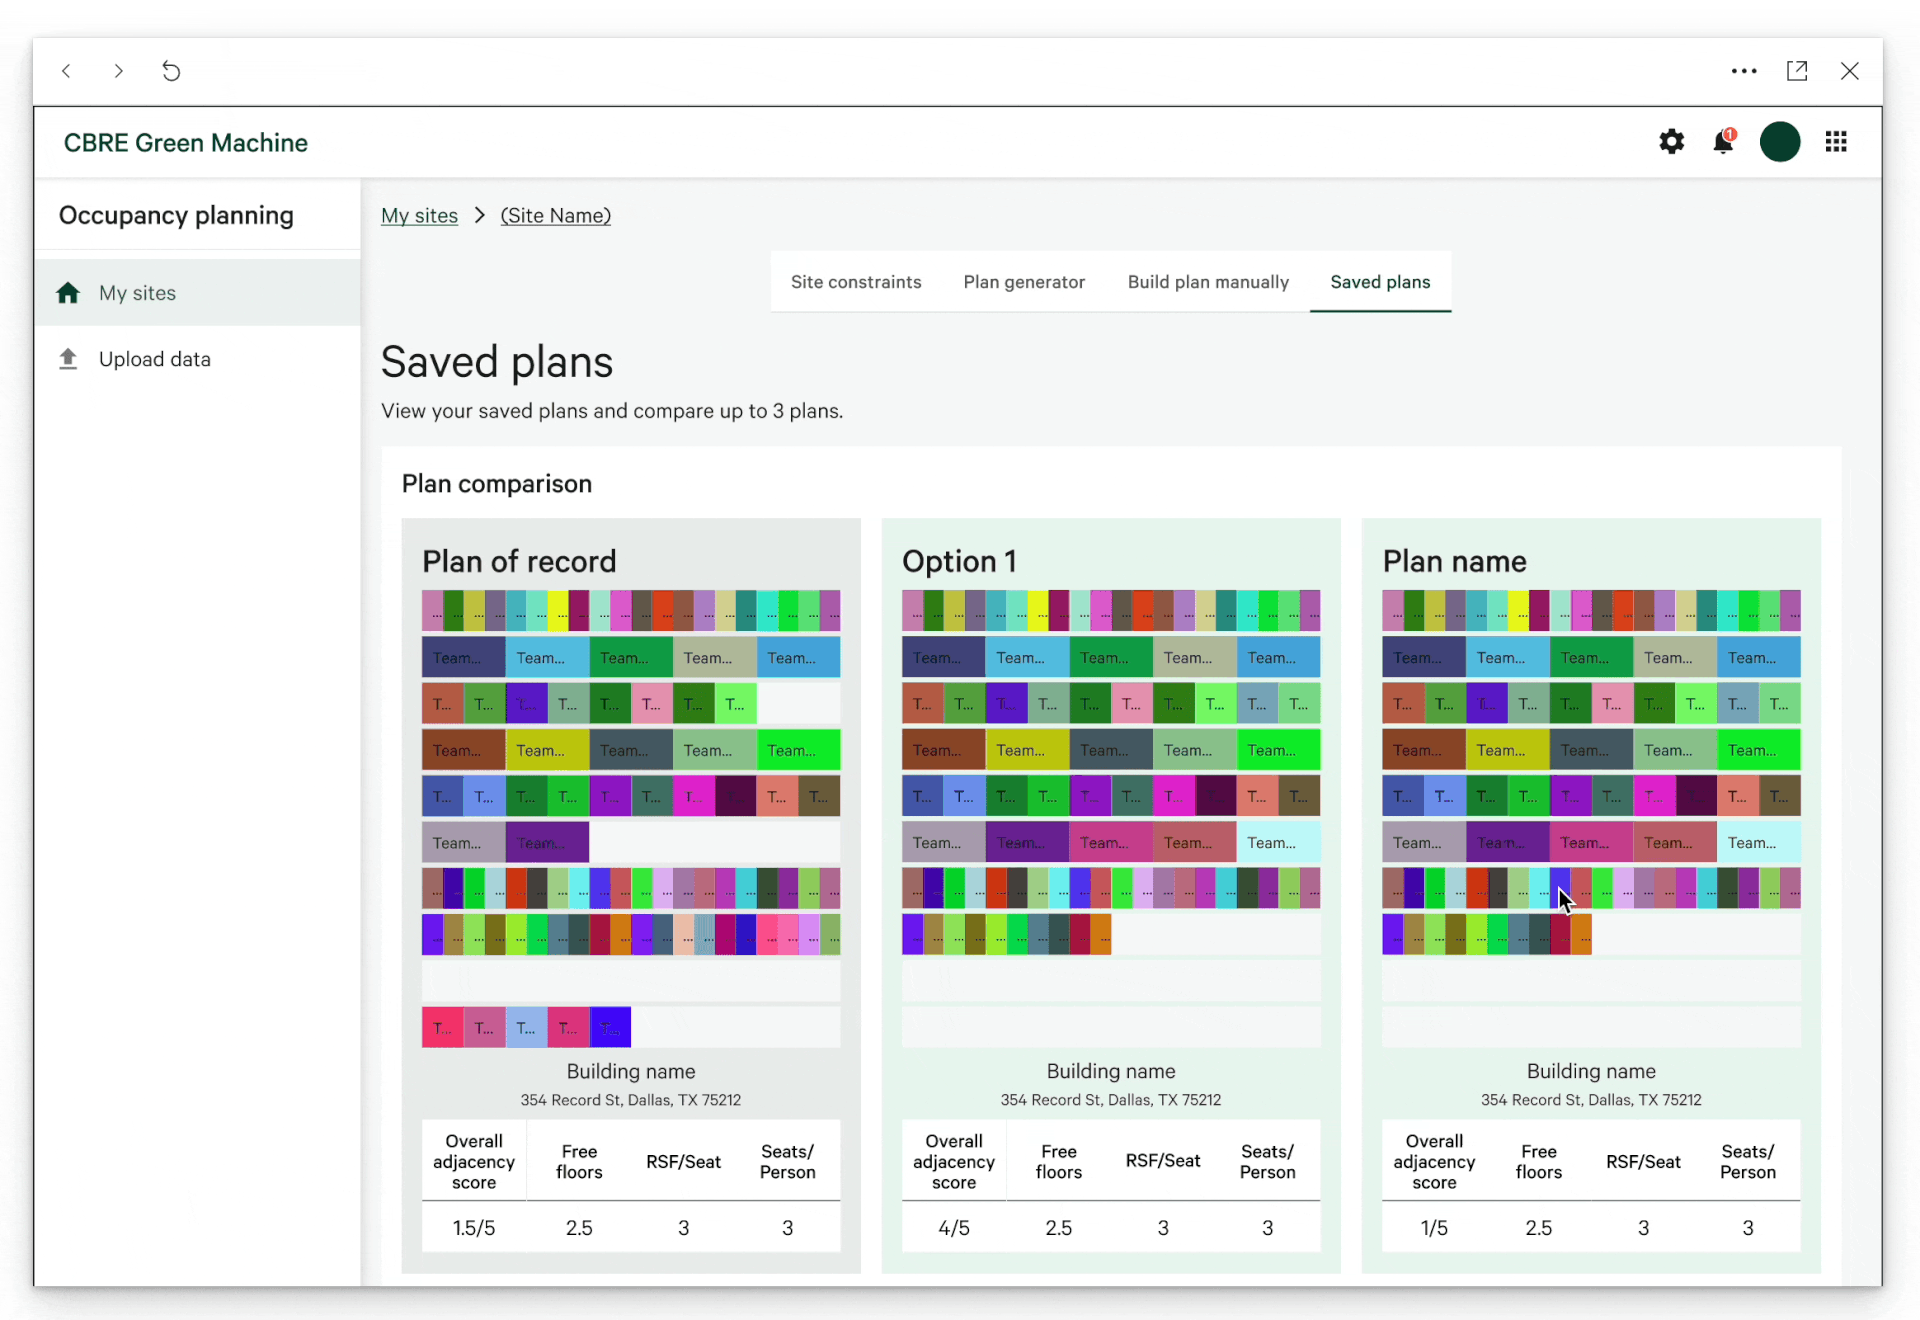
Comparing Saved Plans
They can view and compare all their saved plans in the Saved Plans tab.
Committing a Plan to Record
Occupancy Planners can commit to the plan they want on the Plan Details page.
7. Post Project Assessment

What went well?
Story Maps
• I made improvements each time I did one, ending with a version I will take to every project moving forward.
• They helped bring the ambiguity of the different user types and their needs into focus in artifacts that empowered execution.
Collaborating
• The Product Team and user representatives were critical in creating User Scenarios, Personas, and Story Maps.
• They all were happy and willing to participate once they saw the benefit these artifacts provided.
Trust
• I had a Business partner with a strong vision but needed help making it a usable experience.
• They didn’t always agree with my methods or direction but trusted me enough to give it a chance.
• That trust and their collaboration led to 100% validation for the concepts we tested and helped me design a reusable user workflow framework.
What could have been different?
Gathering Requirements
I should have stepped up and helped with structured requirements sooner. I asked to start using Story Maps early on and got no interest. I should have just pushed forward.
UX Backlog
I was always at max capacity, and having a structured and defined backlog from the start would have made it easier to manage and bring on additional designers sooner.
What would have been next?
More in-depth documentation.
• The Business decided to outsource Engineering for the product. The lack of an artifact to map all the data handoffs between user types caused problems for the Engineering team and would be a problem for any new Engineers. We needed those handoffs mapped out.
• Plan histories were a vital feature that got pushed back to focus on releasing faster. We need to document how plan histories would be saved and managed so the Engineering team could estimate the feature's impact in future releases.
We also kept a backlog of experience improvements we would implement after the initial release experiences for all user types.